

This article is a follow-up to Tree Testing: Fast, Iterative Evaluation of Menu Labels and Categories. If you’re looking for details on how to set up and run a tree test, that article has you covered. This article will guide your data analysis and help you find insights.
On This Page:
Tree Testing
Tree testing evaluates the categories and labels in an information architecture. Unlike think-aloud usability testing, tree tests are usually run as unmoderated studies and generate only quantitative data. This method allows you to collect data from a large number of users quickly but requires a different approach to extracting insights. You can’t just sit through a day of testing and jot down notes — instead, you need to perform a systematic analysis to identify data trends and evaluate their significance.
Tree-Testing Metrics
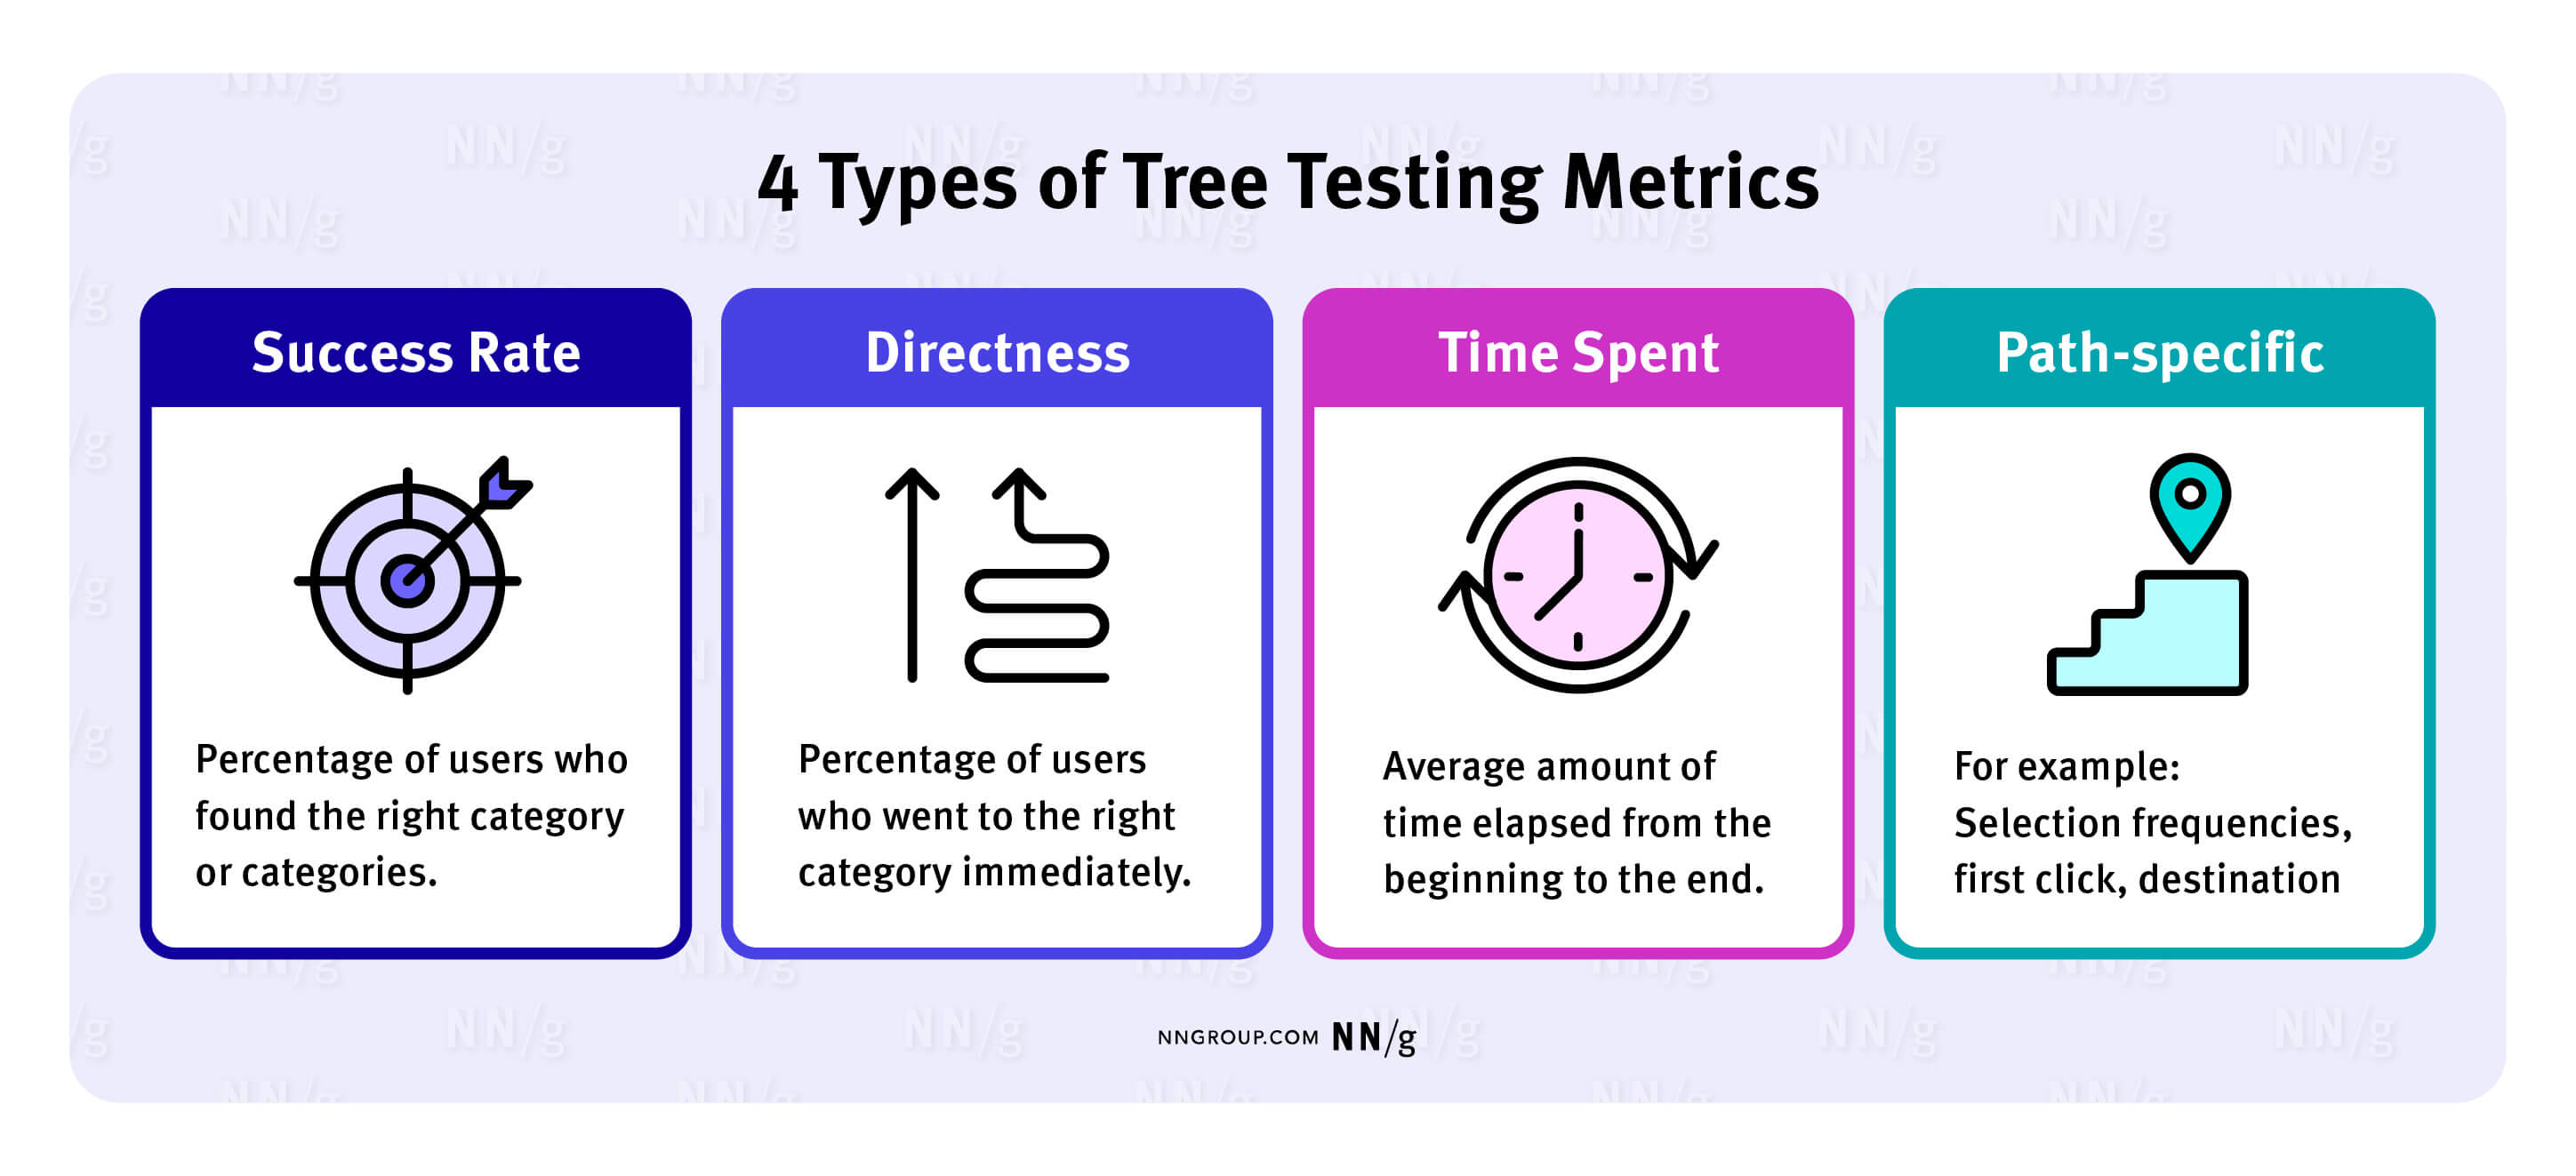
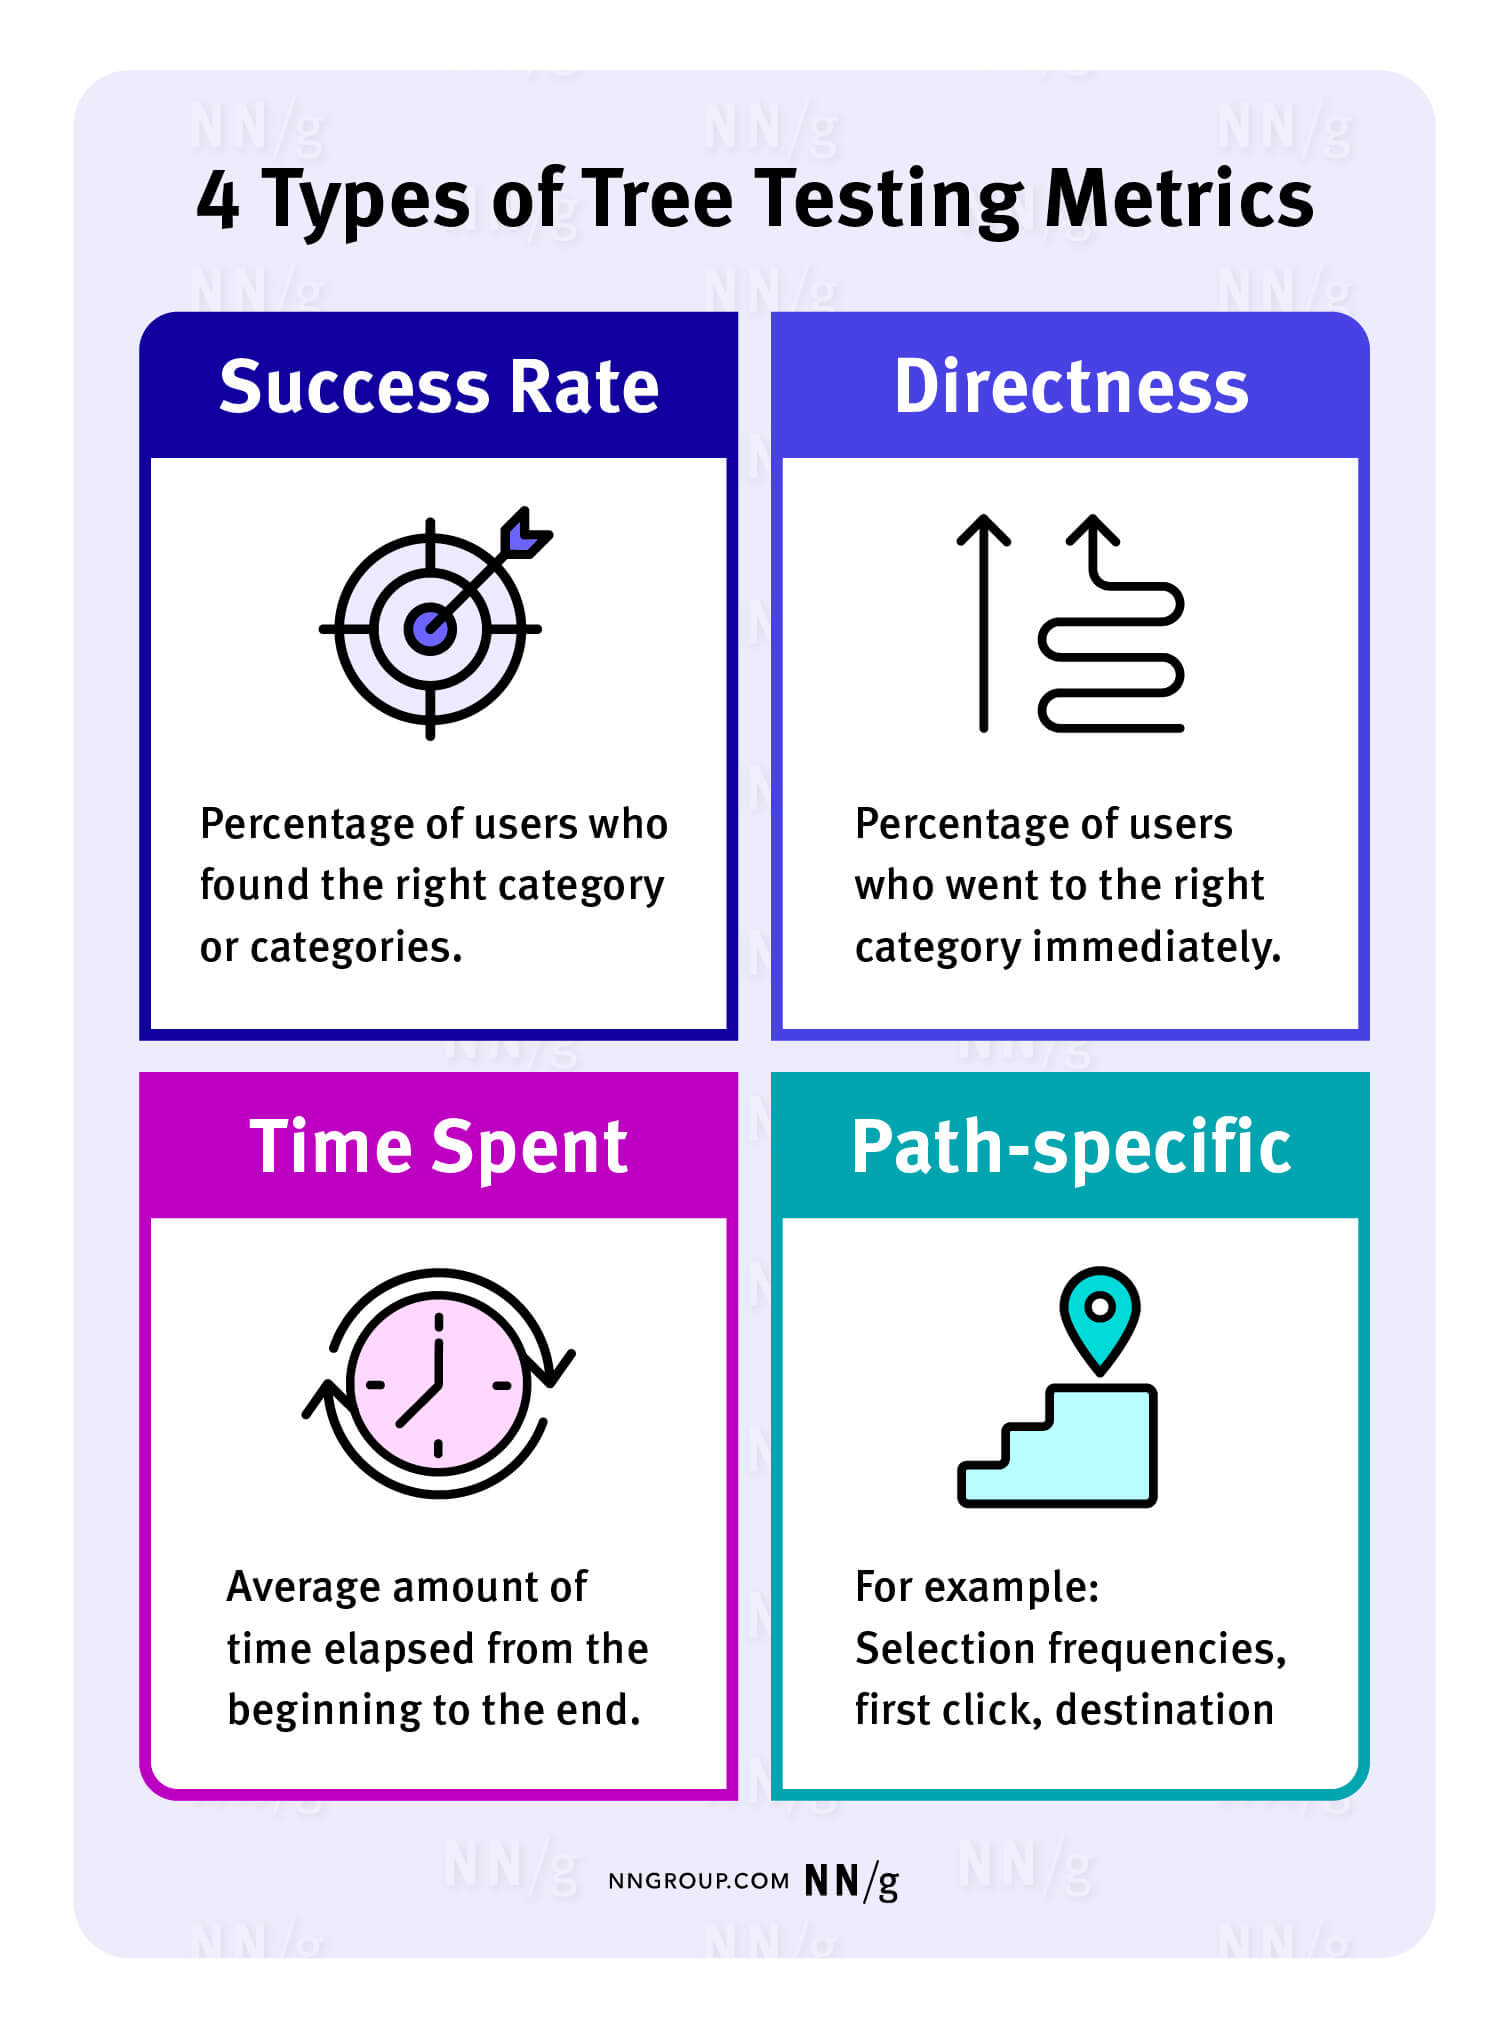
A variety of metrics capture how users understood (or misunderstood) your categories. Treejack and UserZoom (the two most common tree-testing tools) use slightly different styles for presenting these metrics, but both provide these quantitative measures for each task in your study:
- Success rate: The percentage of users who found the right category (or categories) for that task
- Directness: The percentage of users who went to the right category immediately, without backtracking or trying any other categories
- Time spent: The average amount of time elapsed from the beginning to the end of the task
There are also more detailed path-specific measures:
- Selection frequencies for each category in the tree: How many people tried each category
- First click: The category most people selected first
- Destination: The category most people designated as their final answer
Depending on the type of tree and tasks in a study, some of these metrics may be more useful than others at predicting how well the information architecture will perform in real life.
Success Rates: What’s a Good Standard?
To calculate the success rate, you must assign at least one ‘correct’ answer for each task. The success rate for that task indicates the percentage of users who found the correct location in the tree and identified it as the right place to complete that task. Any trials where users selected a different final location are reported as failures (even if they clicked on it but then backtracked and chose a different answer).
For example, 100 participants were asked to find information about the New Mexico State Library. If 67 out of 100 participants selected the correct location, the success rate for that task is 67%.
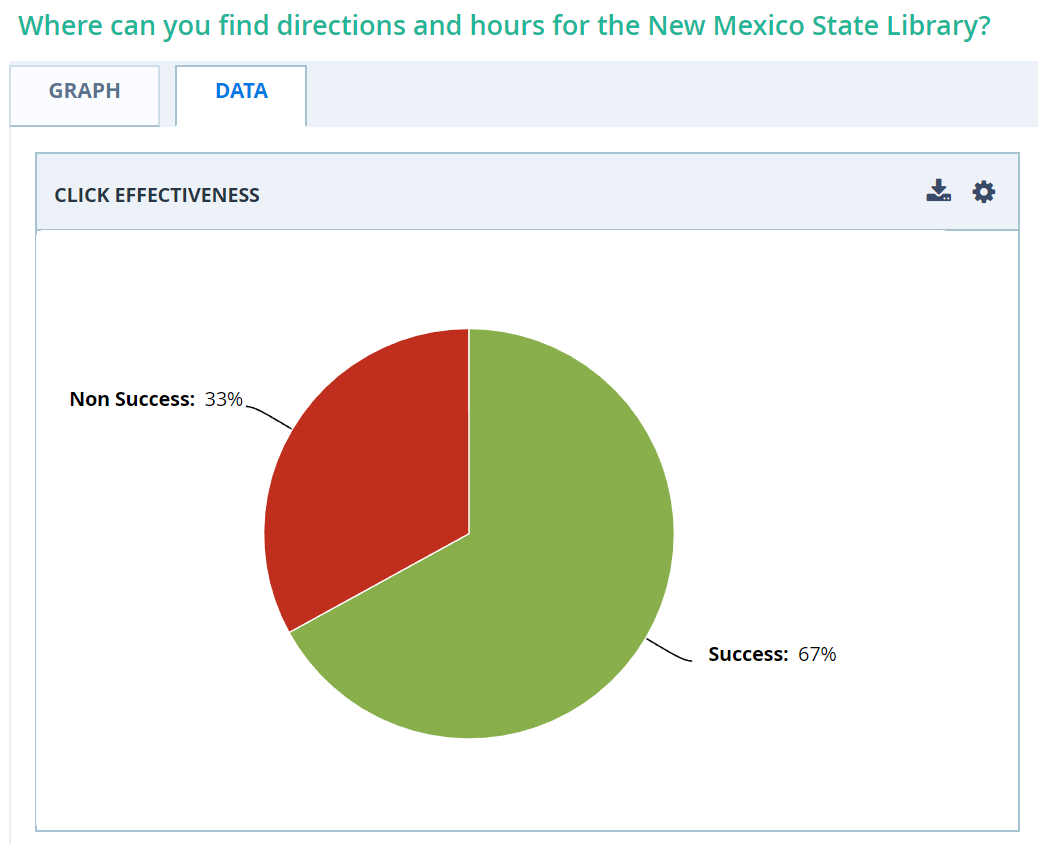
On the surface, the success rate seems simple: higher is better. But to act based on this metric, you first need an appropriate frame of reference to determine what a ‘good’ success rate is for both the overall tree and for a specific task.
Bill Albert and Tom Tullis reviewed 98 tree-testing studies. They found that the median success rate for tasks was 62%, with the interquartile range from 37% – 83%. Their suggested rubric for task success scores in a tree testing study is:
- Poor: <40%
- Fair: 41% – 60%
- Good: 61% – 80%
- Very Good: 80% – 90%
- Excellent: >90%
So, in our example with the New Mexico State Library, a success rate of 67% falls into the “good” category. But remember, these numbers are a starting point. In any quantitative study, the best frame of reference is your own previous data! If we collected the same data last year and found a success rate of 54%, the new rate of 67% would look pretty great in context.
Also consider the type of task you are asking people to complete: a mission-critical or revenue-generating task should have a very high success rate (ideally >90%), whereas a task asking someone to find corporate history is not so critical. For a state library, hours and directions are probably quite important. So even though our success rate is 67% and falls in the “good” range, we should probably work to improve it.
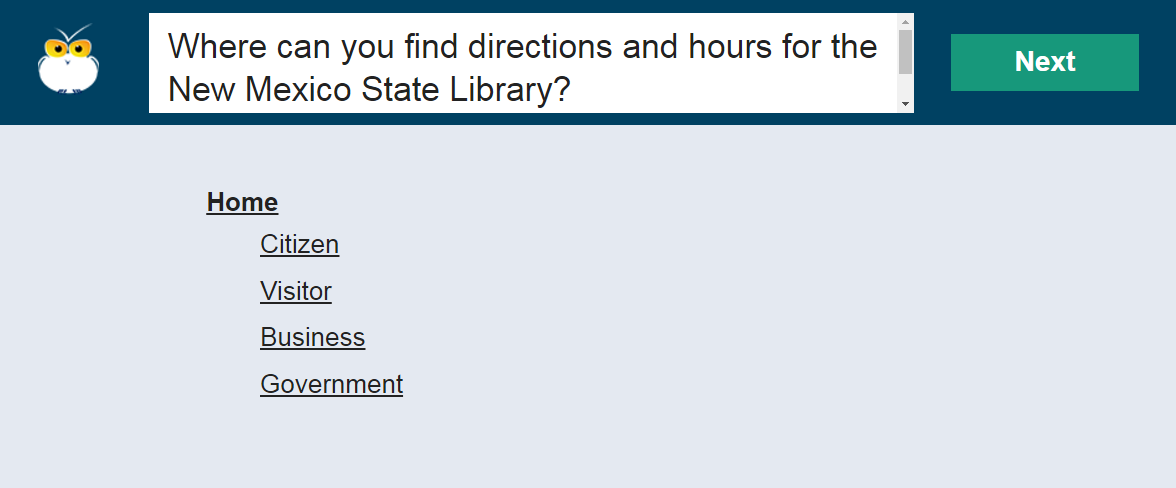
By its very nature, tree testing eliminates many helpful design elements, such as the search function, secondary navigation options (like related links), and any context cues from the visual design or content. Users see only the stripped-down navigation menu itself. (This is intentional because it isolates the navigation structure from all other variables that might influence findability.)
Because tree tests are so simplified, success rates are often much lower than in regular quantitative usability studies. A 67% success rate on a tree test could easily become a 90% success rate on the final design. (However, this increase would happen only if the rest of the design was well executed. A bad search implementation or poorly designed menus can reduce success rates below levels observed in a tree test.
Instead of expecting to achieve a 100% success rate, use a more realistic frame of reference to determine the acceptable success for each task, taking these two factors into account:
- The importance of that task to the overall user experience
- How the success rate compares to that of other similar tasks (e.g., tasks which target content at the same level in the hierarchy)
For example, consider two tasks and their respective success rates in the table below. The success rate for the food stamps task is much lower than for the other task, but this result is partially because users must drill down three more levels to find the right answer.
|
Task |
Correct Answer(s) |
Success Rate |
|
Where can you find directions and hours for the New Mexico State Library? |
Citizen > Education > Libraries > Library, New Mexico State |
67% |
|
Find the rules that determine who qualifies for food stamps in New Mexico. |
Citizen > Health and Wellness > General Health and Wellness > Human Services Department > Looking for Assistance > Food Assistance > Supplemental Nutrition Assistance Program |
43% |
Rather than comparing these two success rates, it would be more realistic to compare either:
- The success rate for the food-stamps task to that of another task which also targets content that is 6 levels down; or
- The success rate of the food-stamps task performed on two different trees with different labels — one which uses the term Food Assistance and one with the term Food Stamps.
Directness and Time Spent Are Measures of Effort
In addition to measuring how many users got to the right place, it’s important also to consider how much they struggled along the way.
Two common tree-testing metrics signal effort:
- Time spent, which indicates how long it took users to find the right answer
- Directness, which captures how many users went immediately to the right answer, without backtracking or changing categories (Direct navigation is also sometimes called the “happy path” because it suggests smooth interaction, with minimal confusion or detours.)
Tasks with high success rates can still be a poor user experience if users must retrace their steps and try multiple places before finding the right answer.
For example, consider this task about finding the cost of tuition:
Where would you go to find tuition amounts?
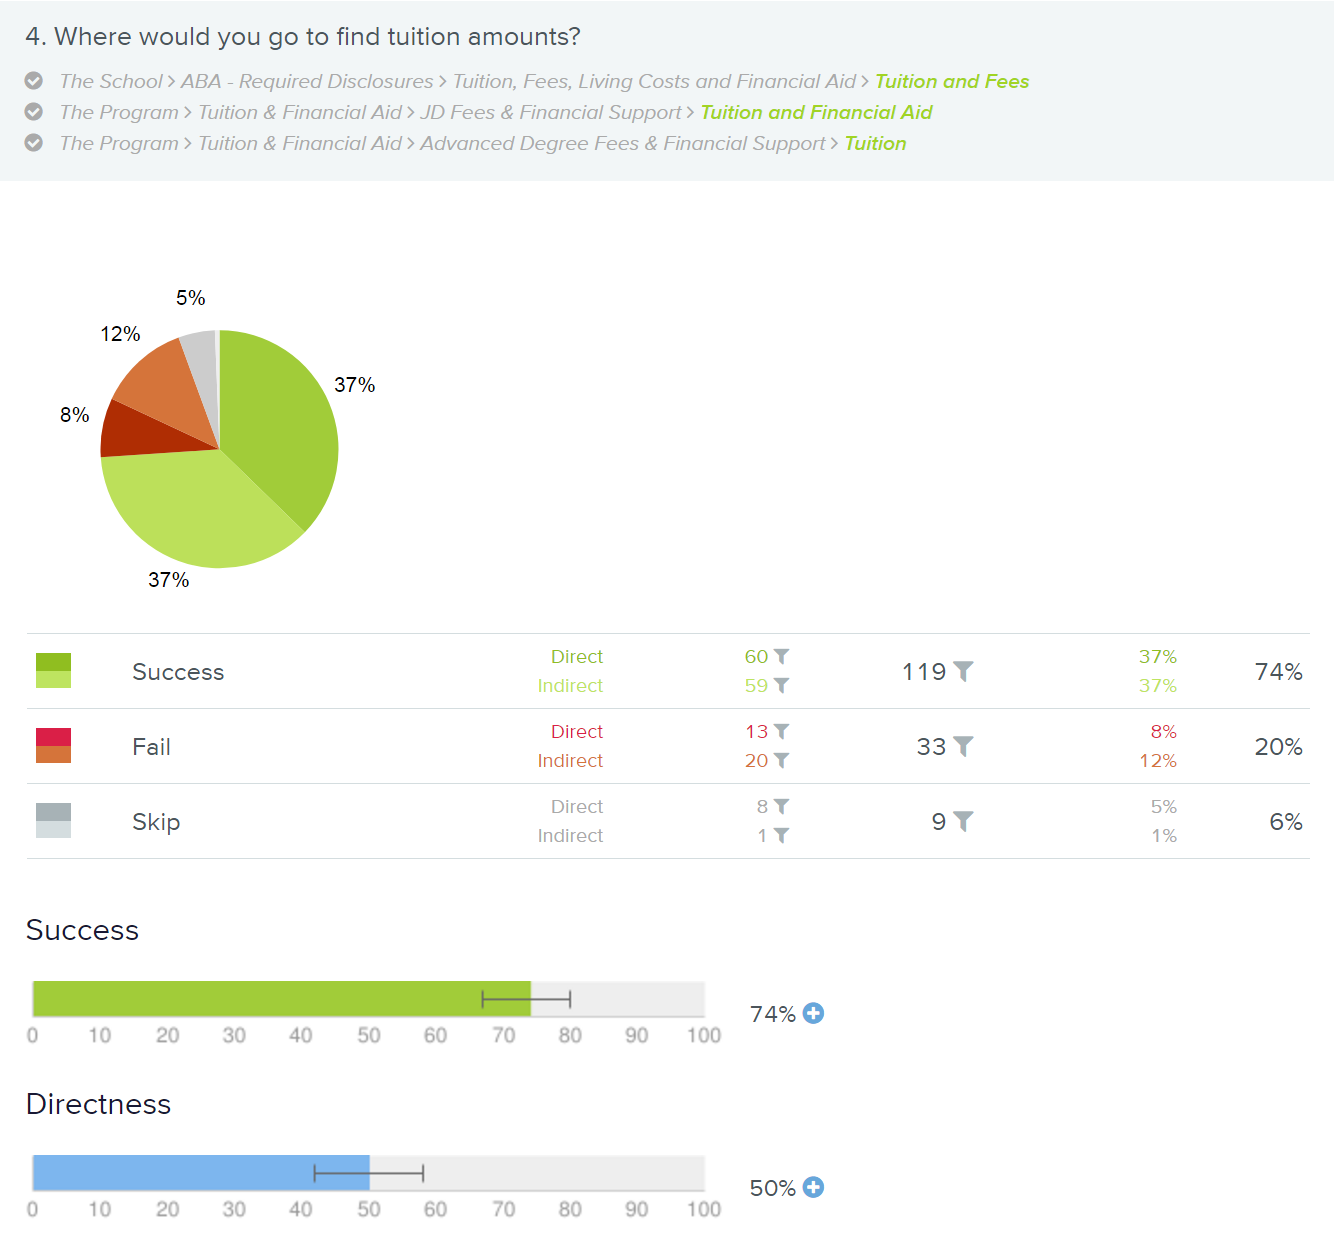
It is also worth noting that users can directly fail a tree-testing task, too — meaning that they could confidently go to the wrong place, with no backtracking, and assume the answer should be hosted there. This is a particularly bad result!
Time spent is also worth investigating in detail, as it adds additional understanding of the mental effort involved in finding a resource. If users spent a long time, even if they are ultimately successful, it may have been a challenging, mentally taxing process. One way to start analyzing task times is to compare times for the various tasks in your study and identify tasks with relatively long times.
Both time spent and directness give an indication of how easy a task was for users. Directness is especially important for tasks frequently done by novices or occasional users because they won’t have the benefit of learning and remembering locations from past experience.
Pathways: First Clicks to Final Destinations
Success rate and directness tell you whether a category is findable; detailed pathway analysis helps you figure out how to improve categories that don’t work well.
The first click for a task is (as it sounds) the category users select first, when they begin that task. In tree testing, the first click is always a top-level category, because none of the subcategories are visible until a parent category is selected.
The first click is critical because it often predicts whether a user will be successful in finding the right item.
Imagine you are looking for the food court in a shopping mall. If the food court is on the top level and you start by taking the escalator down, your chances of finding it any time soon are slim. But if you start by going to the right level, chances are you’ll be able to wander around a bit and find it, if only by the smell of food.
The first click operates in the same way. Once users get in the general vicinity of the correct category, context cues and local navigation make it more likely that they find the answer.
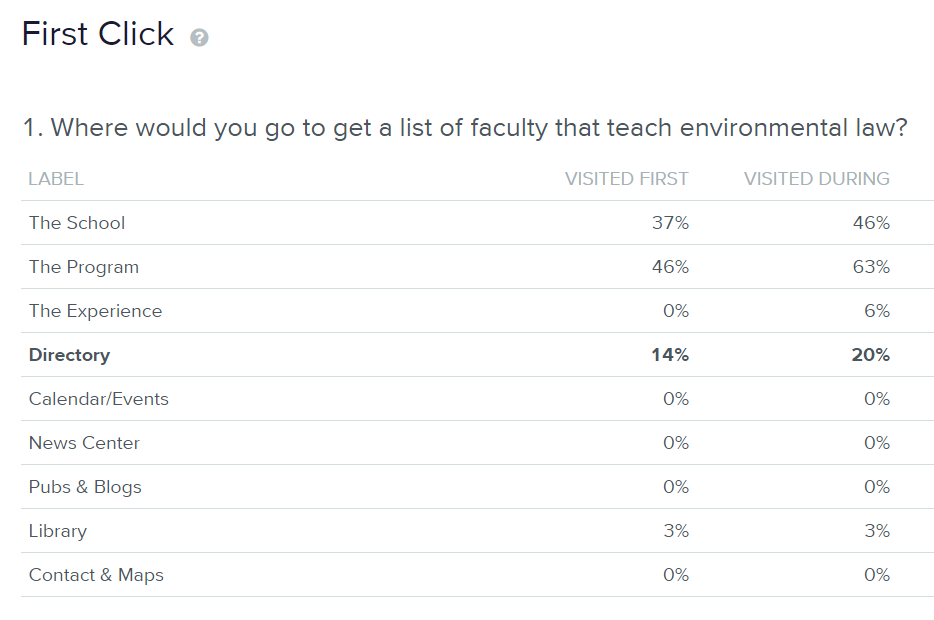
However, incorrect first clicks are often disastrous. The table below shows the first-click data for a task that had only a 20% success rate. The correct top-level category, Directory, received only 14% of the first clicks. Instead, users started in the Program or School sections, and most ended up wandering around those areas and never making it back to the Directory.
Examine the first-click data carefully when:
- A task has a low success rate and/or directness. The first clicks indicate where users initially expected to find that information and suggest locations where the item should be moved (or at least cross-listed).
- The final design will use mega menus that expose both the 2nd and 3rd level categories at a glance. The ability to see and compare multiple sublevels simultaneously can drastically improve success rates above what you would observe in a tree test – but only if the first click is successful and users make it to the right mega menu.
You may have too many overlapping categories if the first clicks in many tasks are distributed across multiple categories. Do a card sort, or review the tree-test results again and look for other possible organization schemes.
Review the final destinations selected by users when the first clicks are correct, but the success rates are low. This pattern suggests that lower-level categories overlap too much.
Polyhierarchy
Tree testing can also be used to evaluate if polyhierarchical classification (also known as cross-listing) is needed for a resource.
Polyhierarchy is a reasonable strategy to accommodate different mental models, but using it too much tends to dilute the clarity of an information architecture. As a result, use polyhierarchy only if your data indicates that a substantial portion of your users will look for an item in multiple parent categories.
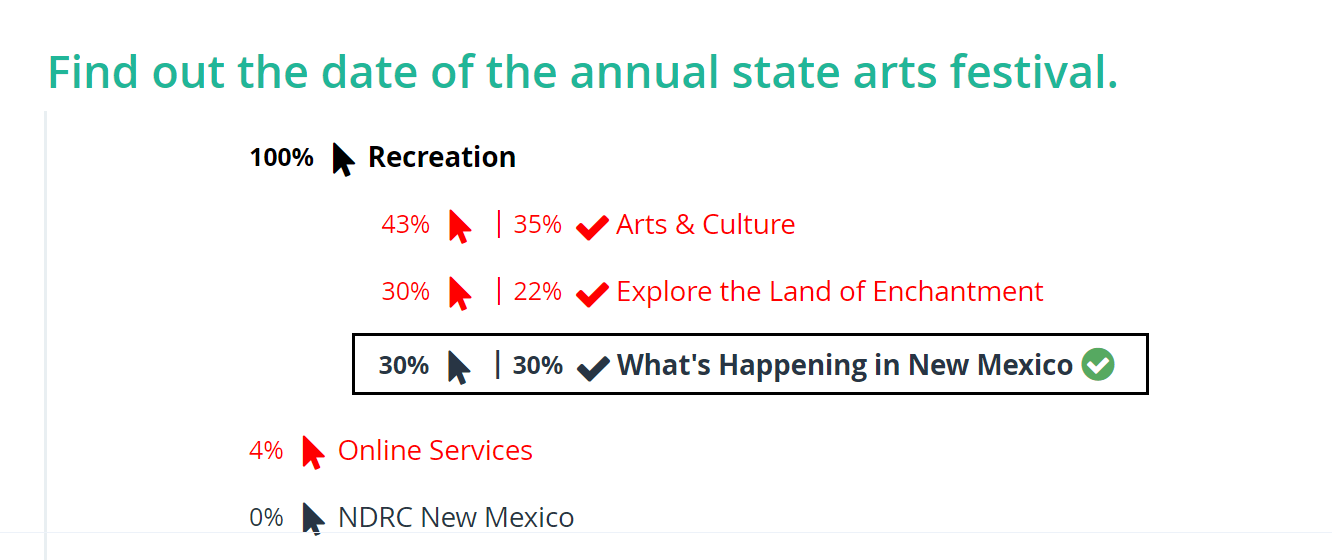
For example, just because you could list Tomatoes under both Fruit and Vegetables in an online grocery store, there’s no reason to put it under Fruit if no one looks for it there! But if 30% of your users looked for it under Fruit and another 30% under Vegetables, then you might justifiably place Tomatoes under both.
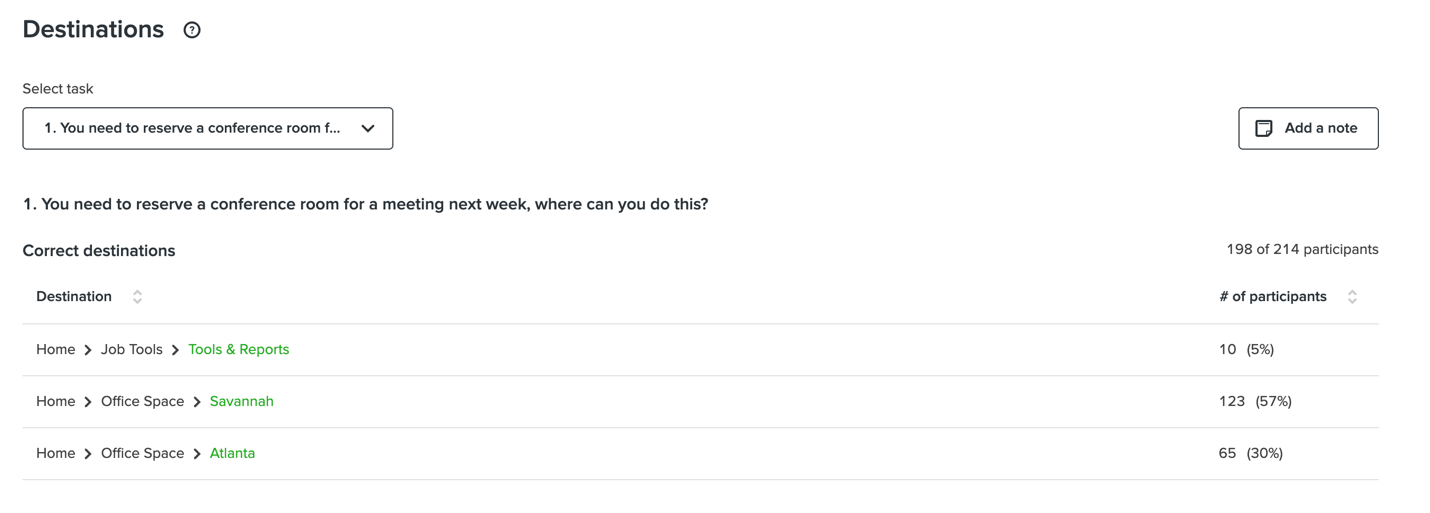
Tree testing is helpful here, as you can mark multiple correct answers for the same task, and then review what proportion of your participants selected each of the correct answers. However, tree testing tools such as UserZoom or Treejack usually surface only the aggregate success rates of all correct answers. In order to see which correct answer your participants selected, you’ll need to review the detailed final-destination data.
If one of the correct answers is rarely (if ever) selected, then it’s unnecessary to have that polyhierarchical classification for that resource. In our hypothetical grocery store example, we could confidently put Tomatoes only under Vegetables.
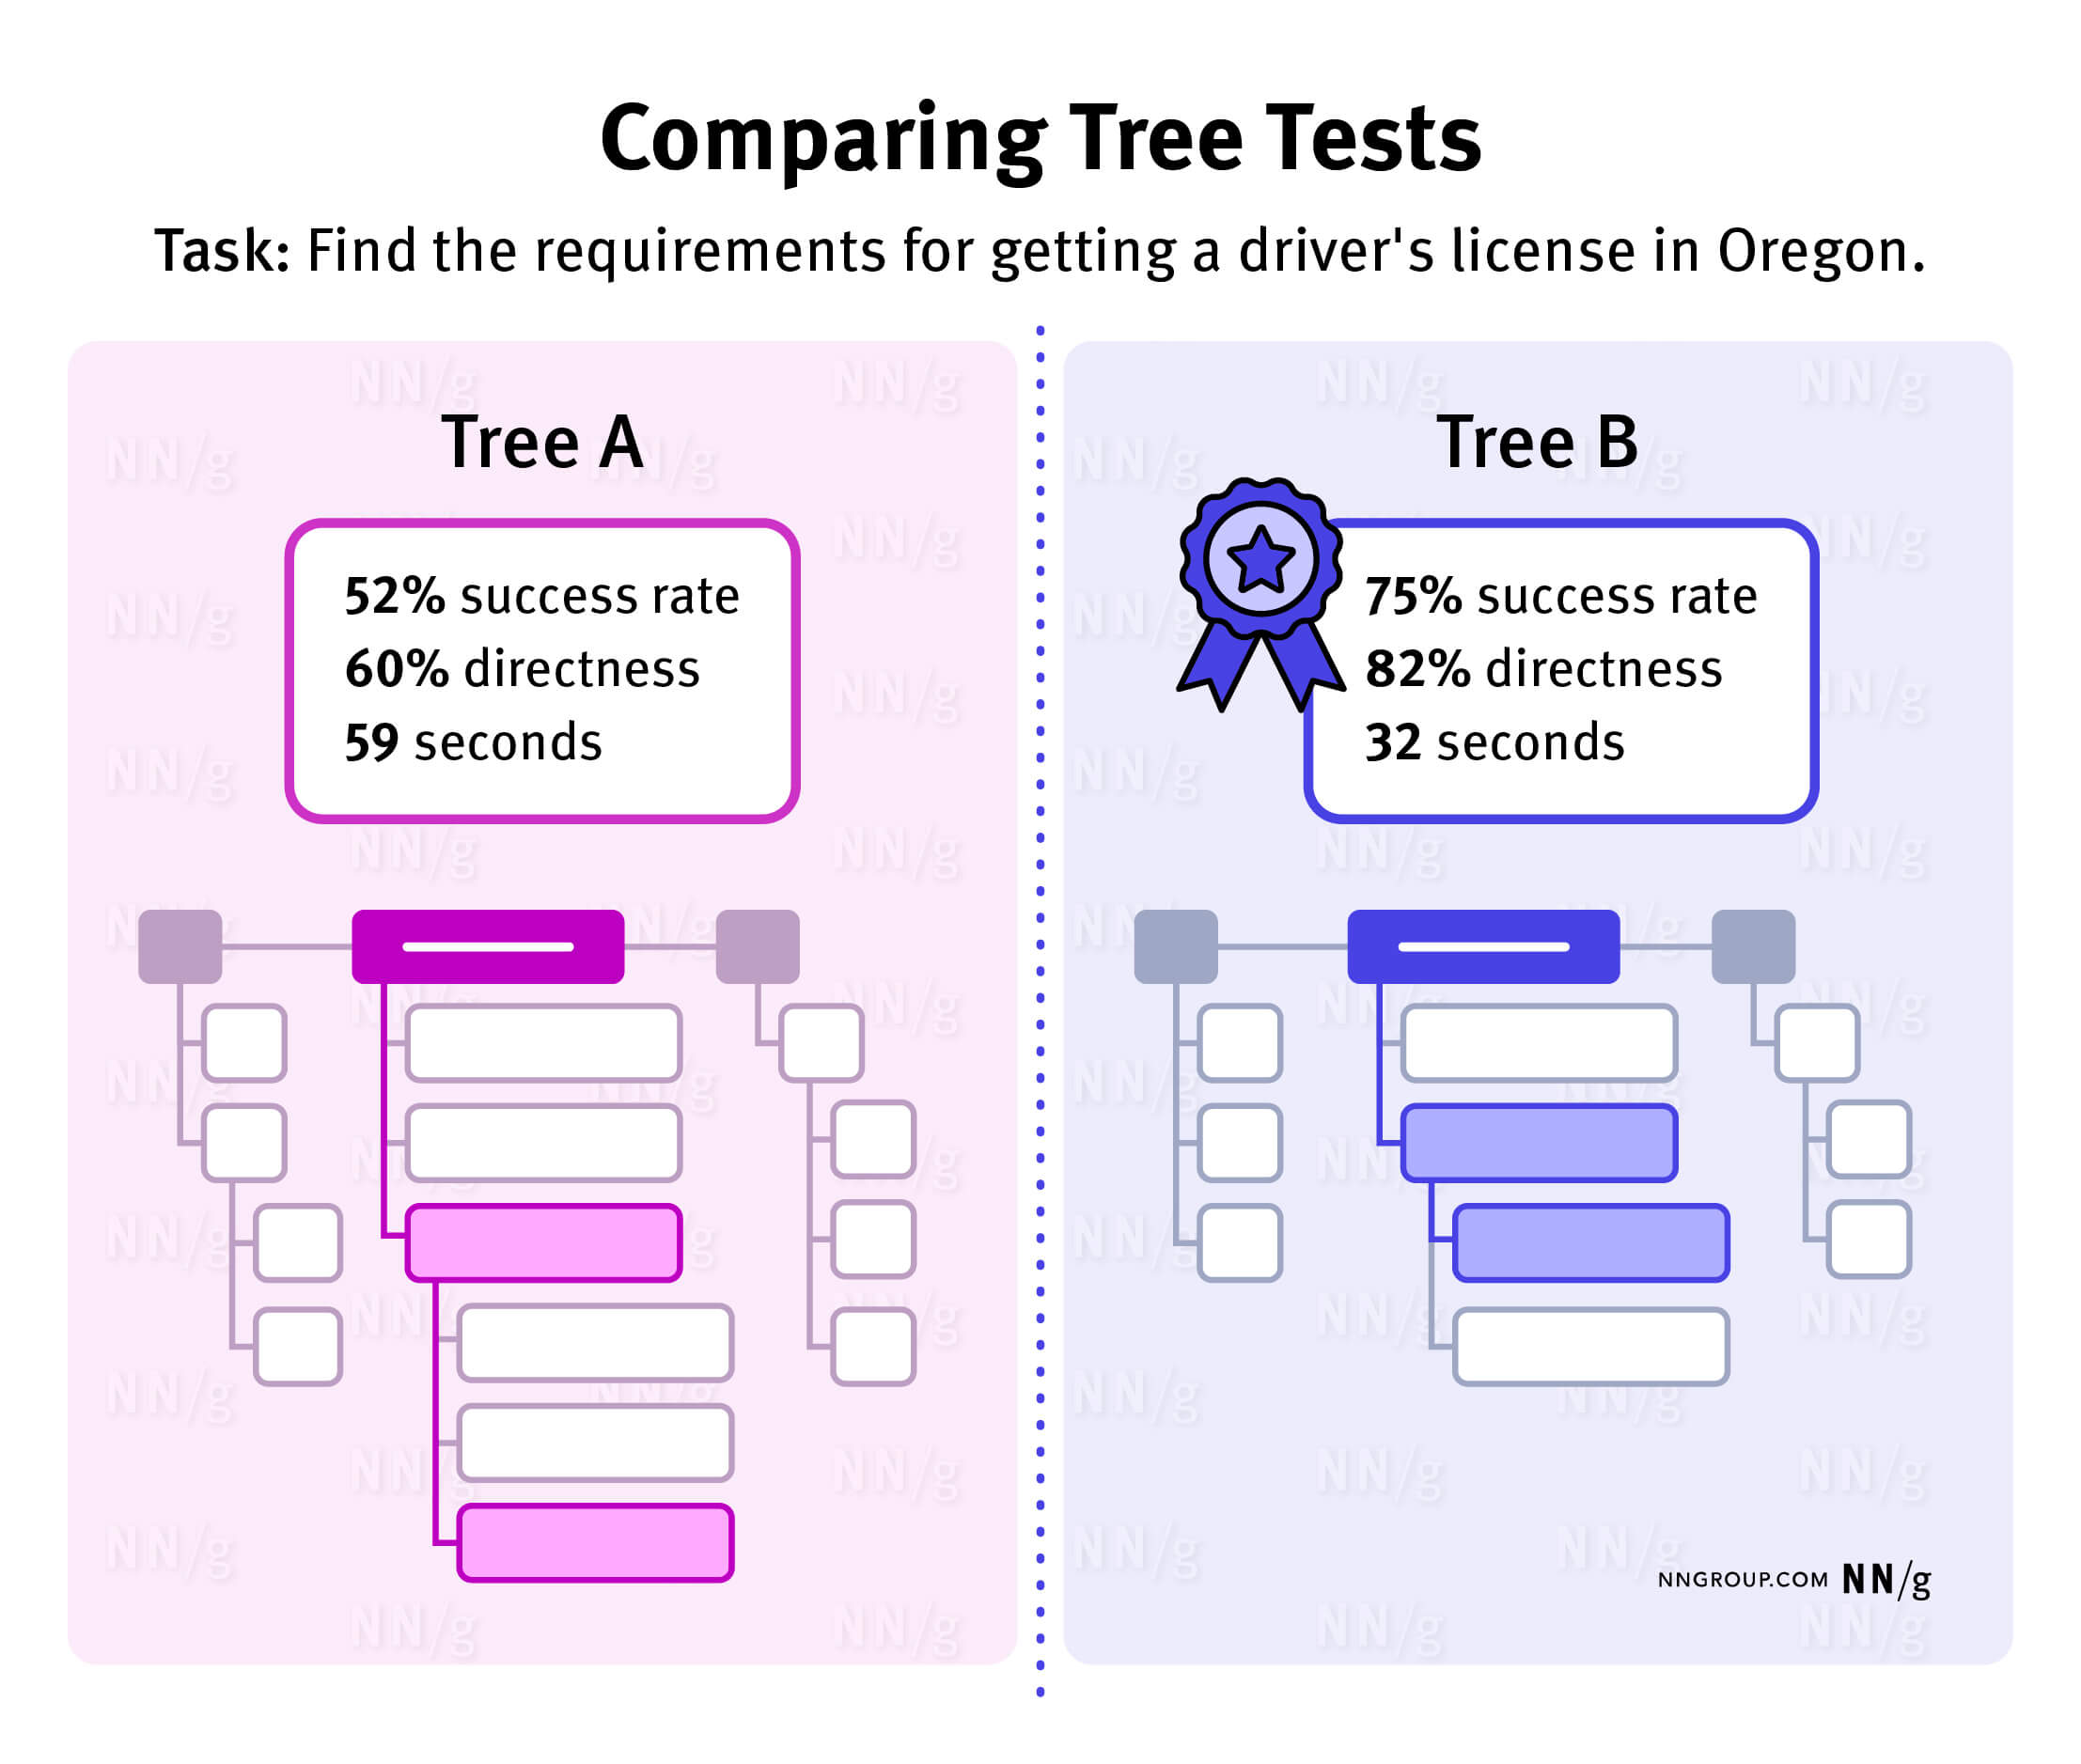
Comparing Multiple Trees
Another valuable use of tree testing is to decide which of two (or more) options for your IA is easiest for users. To do this, you must test multiple trees (typically using a between-subjects design) with the same tasks.
This sort of study usually involves a quantitative comparison between metrics (e.g., success rate, time on task, directness, path-specific measures) associated with each tree. It can be relatively expensive due to the sample sizes needed.(Typically, 50+ participants per tree are needed for a quantitative study to achieve reasonably narrow confidence intervals and find a statistically significant difference between them.)
Note that for comparative studies such as this, you will need to manually calculate whether any differences in task metrics between the two trees are statistically significant, as most tree-testing software will not do so for you automatically.
The type of significance test differs for binary success or directness measures (N-1 2-proportion test for between-subjects design) compared to time on task measures (t-tests are usually used). Also note that with more than two trees, you will need to use ANOVA to discover any statistically significant effect of tree version, and if so, you will use a post-hoc test to identify which statistically significant differences between pairs.
Turning Data into Action
Although tree testing yields quantitative data, the conclusions are by no means obvious. Task success rates are just the first step and must be interpreted within the context of how much users struggled to get to the right answer (directness) and where they expected the right answer to be (first clicks).
Once this analysis is complete, you can identify appropriate solutions. For example:
- When first clicks are evenly distributed in multiple areas, list topics in multiple categories. If this issue occurs for many tasks, consider changing the overall organization scheme.
- When success rate is low but first clicks are correct, change the labels of subcategories to be more distinct.
Reference
Bill Albert and Tom Tullis. 2023. Measuring the User Experience. (3rd Ed.) Morgan Kauffman, Cambridge, MA.