

A strong Stratospheric Warming event is currently active. It has brought a major disruption of the high altitude circulation and is set to impact the lower levels. Looking ahead, we can already see this event’s first major weather impacts across North America and Europe.
The Sudden Stratospheric Warming event (SSW) is now here, and it is leaving a strong mark on the Polar Vortex and the atmosphere. You will see the latest atmospheric conditions with the active SSW and the Polar Vortex breakdown.
But we will focus more on its actual weather impacts, already seen in the forecast. The most prominent effects are currently trending towards the North Atlantic and over Greenland, impacting the entire North American region and Europe.
ATMOSPHERIC POLAR VORTEX PRESENCE
To understand what is currently happening, we must know what the Polar Vortex is. In simple terms, it is a single name that describes the broad winter circulation over the northern (and southern) hemispheres.
Below, you can see a 3-dimensional image of the Polar Vortex. The vertical axis is greatly enhanced for better visual presentation. In addition, you can see the actual structure of the Polar Vortex, connecting down to the lower levels to the pressure systems.
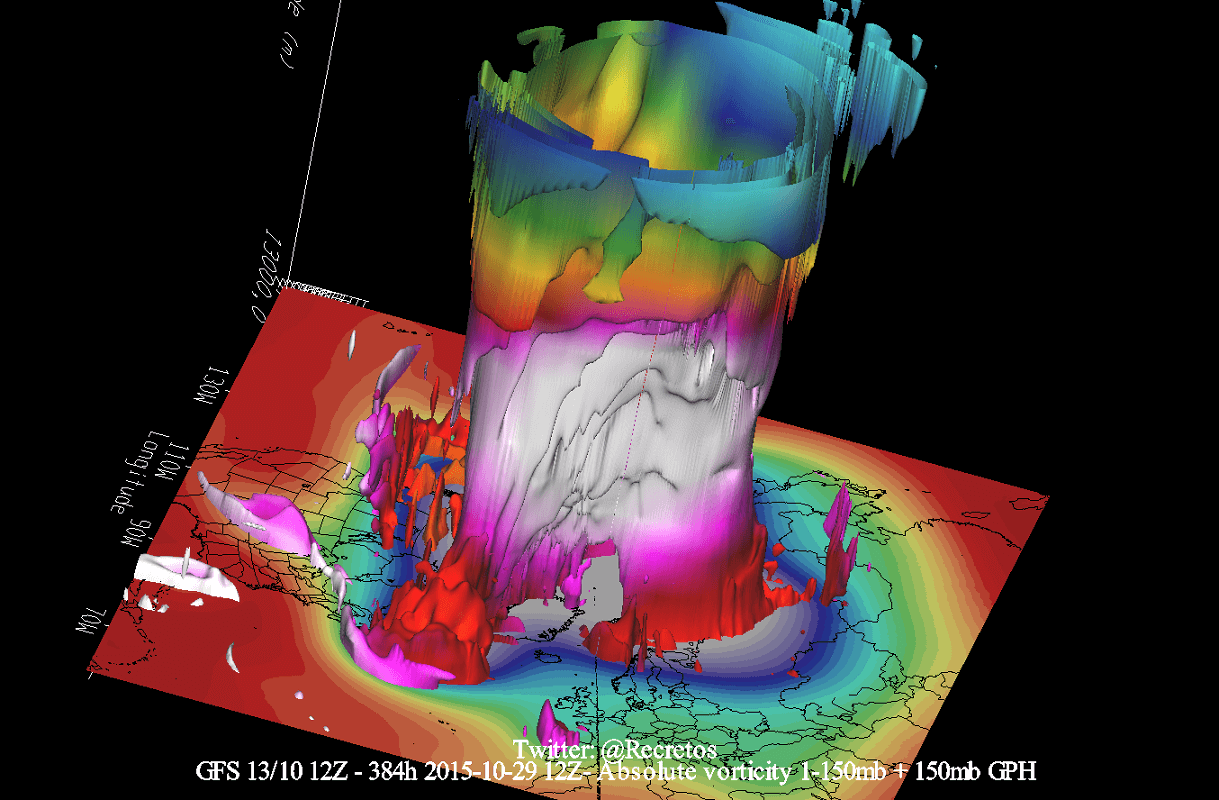
The Polar Vortex extends high up into the atmosphere. You can see the atmospheric layers in the image below. The lowest level of the atmosphere is called the troposphere, where all the weather events are. But above that, we have the Stratosphere, a deeper and drier layer and the home of the ozone layer.
For this reason, we tend to separate the entire Polar Vortex into an upper (stratospheric) and a lower (tropospheric) part. They both play their role differently, so we monitor them separately. But it is also very important if they are properly connected—image by NOAA-Climate.
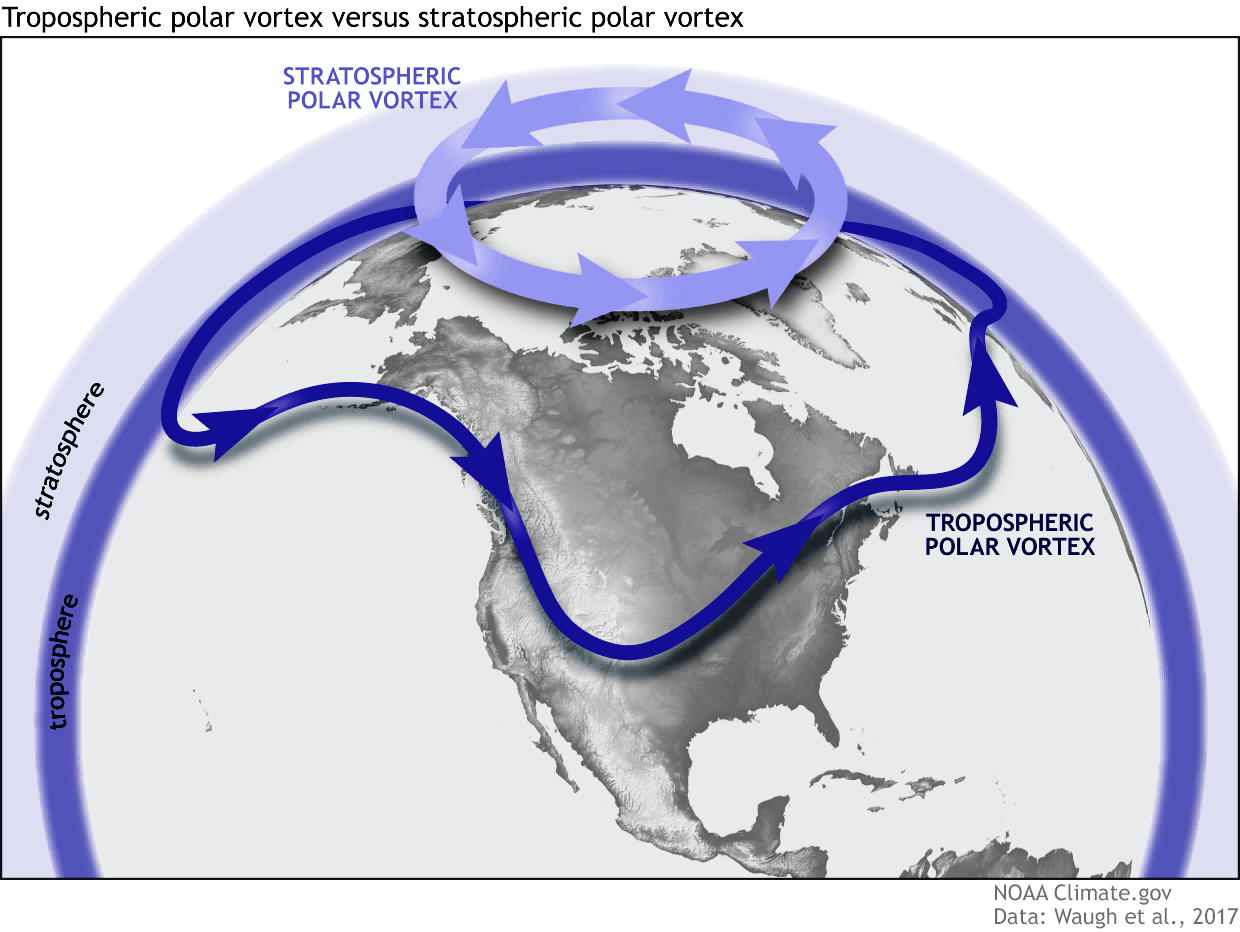
So to recap, the Polar Vortex behaves like a very large cyclone, covering the whole north pole down to the mid-latitudes. It is connected through all atmospheric levels, from the ground up, but has different shapes at different altitudes.
We monitor any Polar Vortex activity because it can affect weather across the entire Northern Hemisphere. And it can impact the weather differently, depending if it is weak or strong.
A strong Polar Vortex usually means strong polar circulation. This locks the colder air into the Arctic circle, creating milder conditions for most of the United States and Europe.
In contrast, a weak Polar Vortex creates a weak jet stream pattern. As a result, it has a harder time containing the cold air, which can now escape from the polar regions into the United States and Europe—image by NOAA.
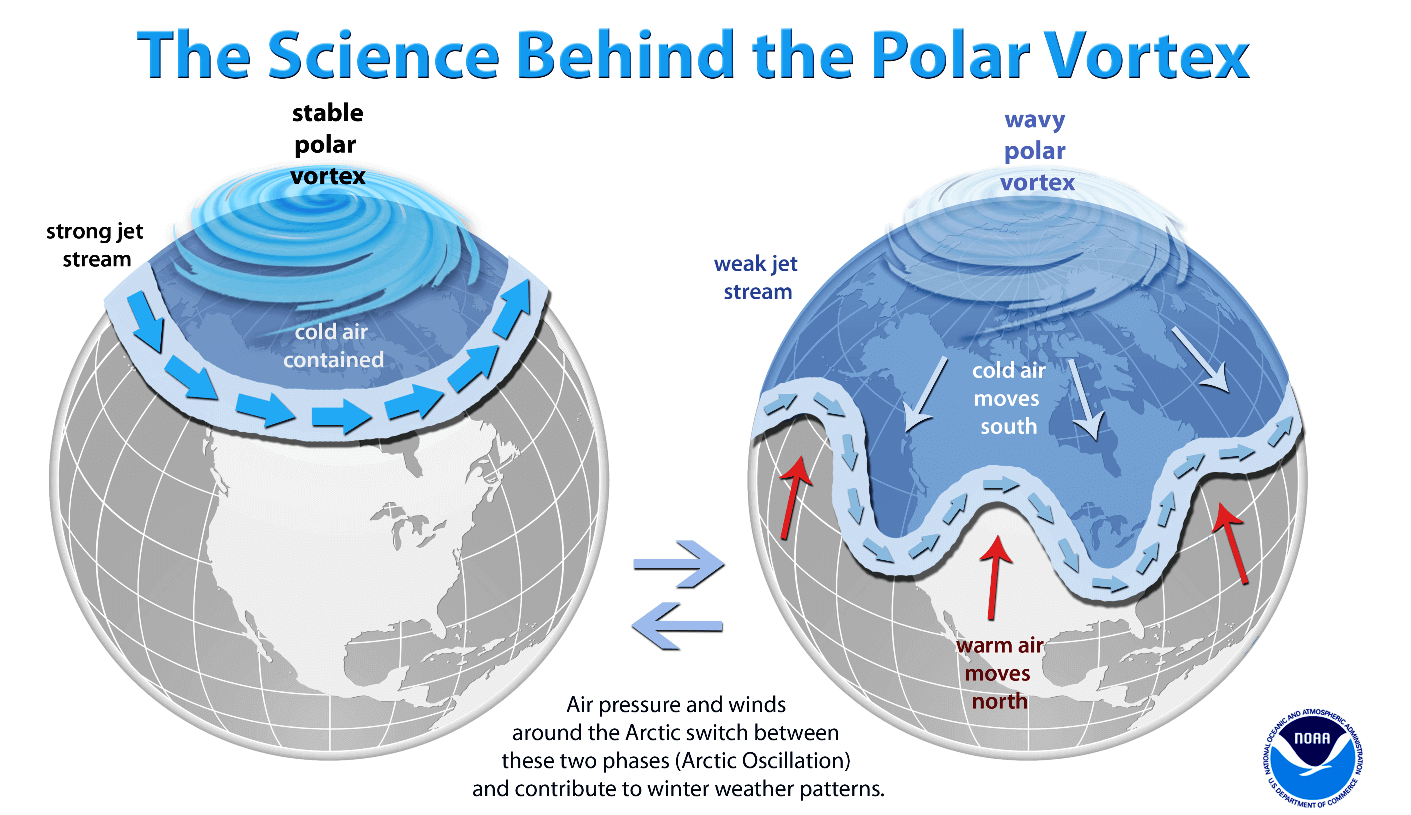
This is why a Sudden Stratospheric Warming event (SSW) can be such a game-changer, as it can shift the mode from a strong to a weak Polar Vortex quickly.
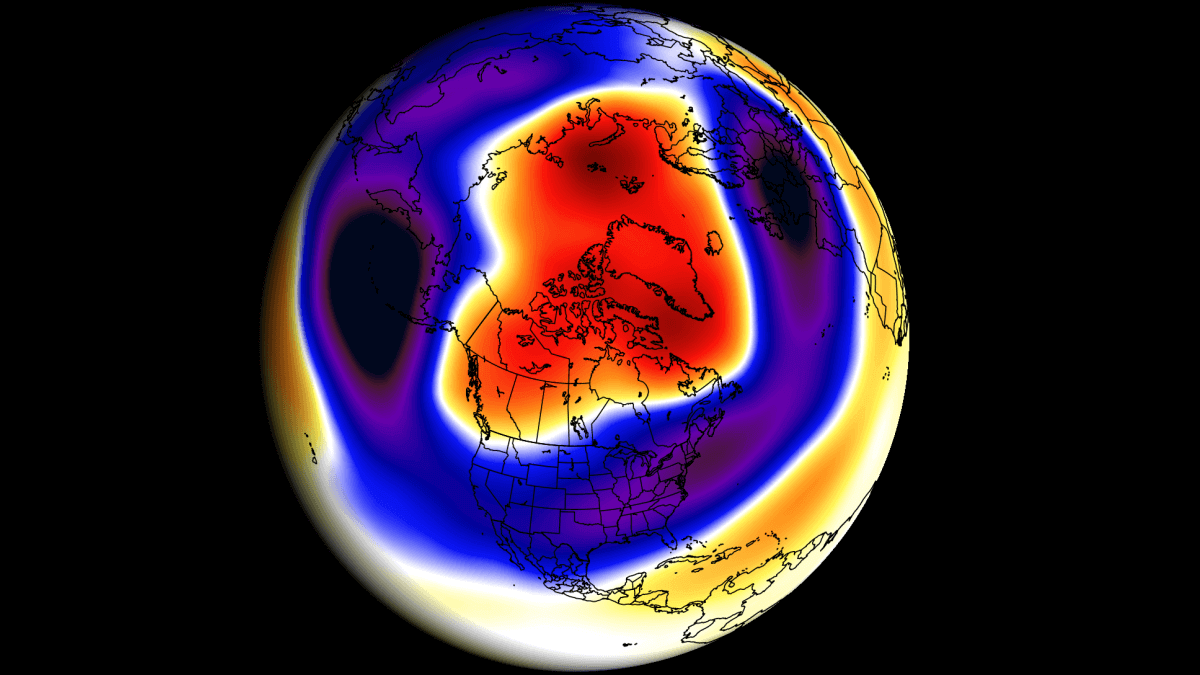
To put the Polar Vortex into perspective, we produced a high-resolution video below, showing the Vortex spinning over the Northern Hemisphere in the Stratosphere at the 30mb level, around 23km/14miles altitude.
The video mainly shows that the Polar Vortex is a large cyclonic area spinning over the entire Northern Hemisphere. It extends from the ground up to the top of the Stratosphere and beyond, reaching over 50km/31miles in altitude.
So, what are we looking at in the near future with the Polar Vortex and the weather circulation? In the next image below, you can see the westerly wind speeds across the atmosphere. The bottom is the surface layer, and the top of the image is the top of the Stratosphere.
You can see large negative areas in the Stratosphere. Negative values imply easterly winds and a reversed circulation. This is basically a breakdown of the circulation, with no recovery seen in the near future.
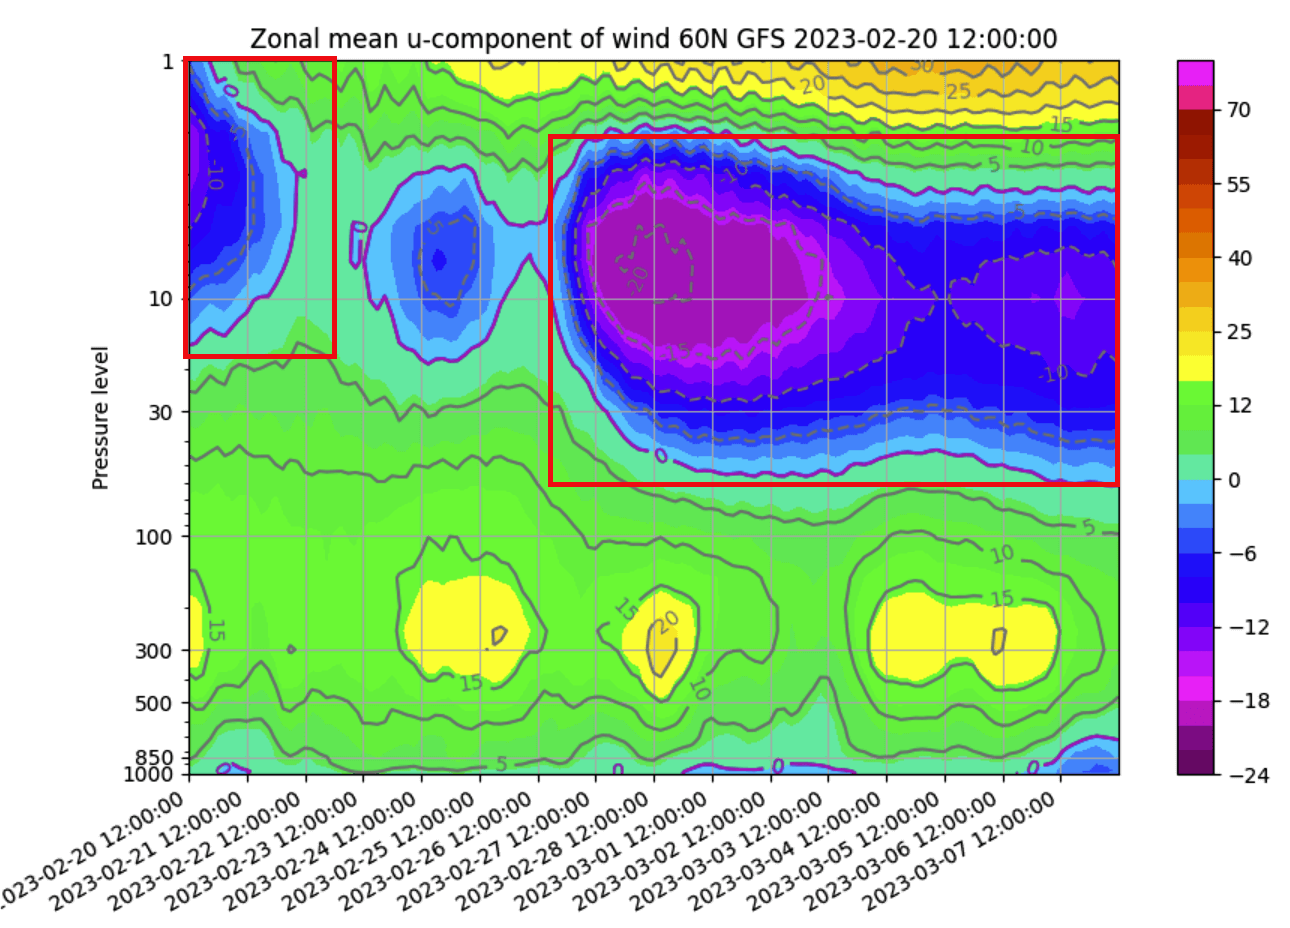
The influx of energy into the Stratosphere created a major disruption and warming, completely collapsing the upper stratospheric Polar Vortex (red boxes). As a result, you can see a proper wind reversal from westerly to easterly (negative values) and the breakdown of the normal circulation.
POLAR VORTEX DISRUPTIONS
So we know that a major disruption and a warming event are happening right now in the Stratosphere. But where do these strong events come from?
Usually, it is from the direct influence of strong pressure systems, having an impact upwards into the Stratosphere. Pairs of pressure systems are also known as Rossby Waves. You can see an example of Rossby waves in the image below by NOAA.
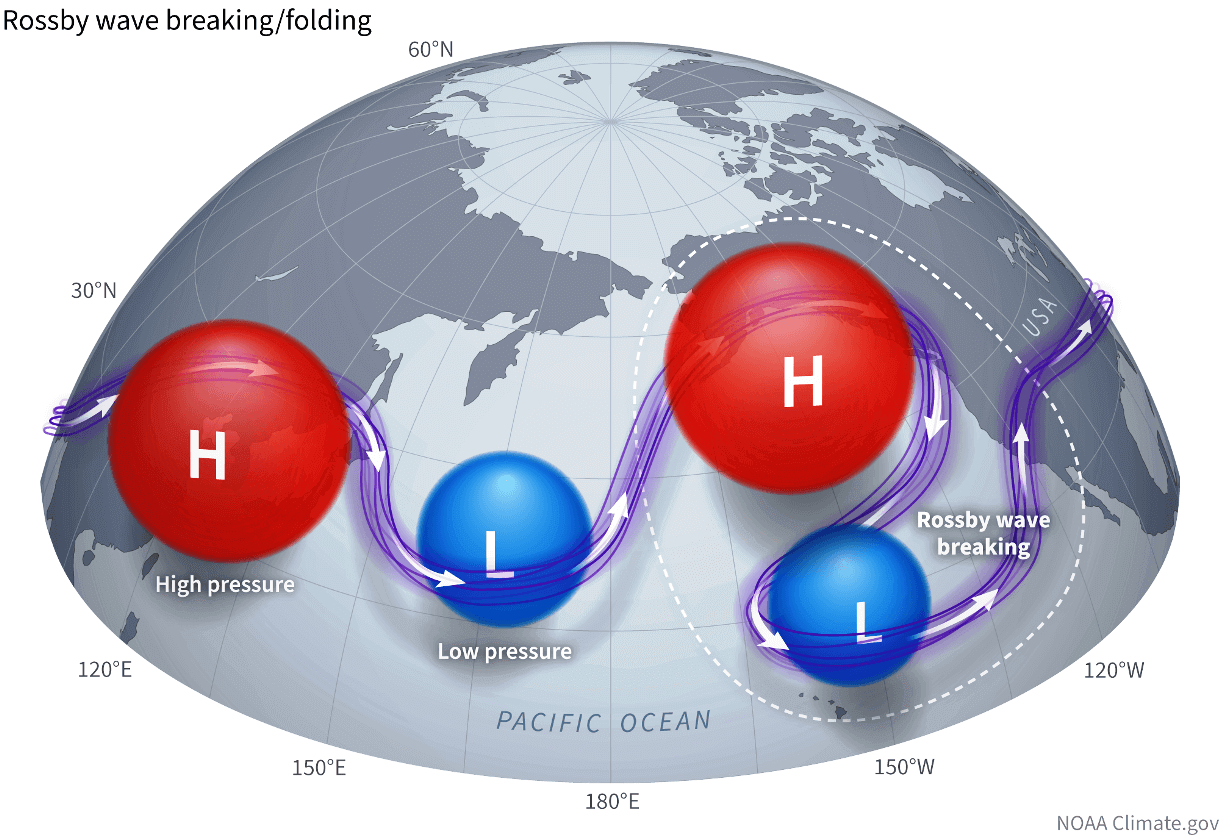
Rossby Waves (a pair of strong high and low-pressure systems) deflect energy upwards into the Stratosphere as they break. That energy can deform the Polar Vortex, temporarily pausing its strengthening or weakening its circulation.
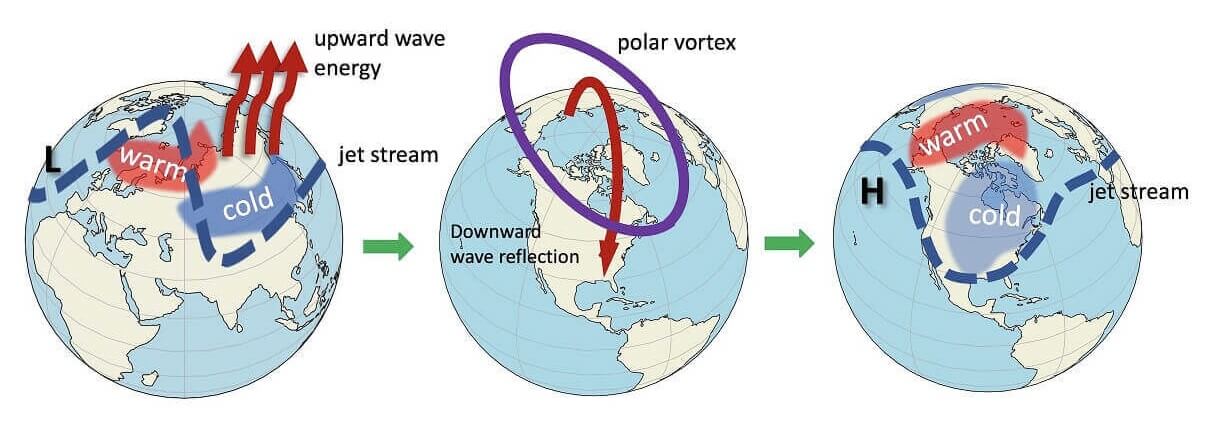
In the image below, you can see the vertical wave activity example. First, the energy goes into the Stratosphere, which impacts the Polar Vortex and creates a warming wave. Later, the disruption in the Stratosphere affects the polar circulation back down, changing the weather patterns on the surface.
The current Stratospheric Warming event was caused by strong Rossby waves in the first half of the month. Below you can see strong pairings of high and low-pressure regions around ten days ago. This setup enabled the “wave breaking,” sending energy upwards into the Stratosphere and disrupting the Polar Vortex dynamics.
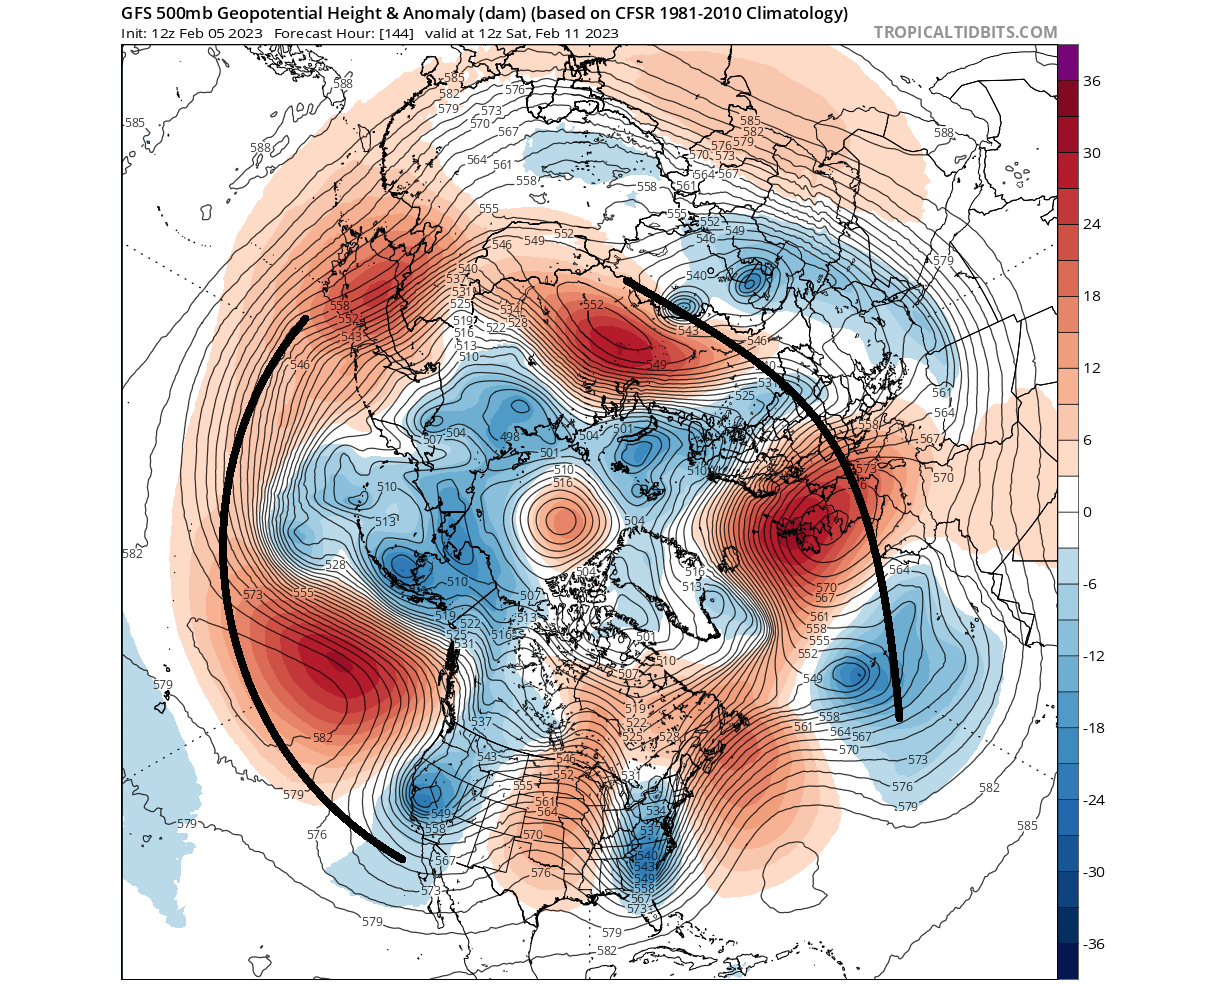
This energy sent upwards is then manifested in the Stratosphere as temperature and momentum. So ultimately, if the disruptions are strong and persistent enough, we can get a major Sudden Stratospheric Warming event.
SUDDEN STRATOSPHERIC WARMING EVENT
The main condition for an official SSW is reversing the stratospheric circulation from westerly to easterly. You can see that in the wind analysis below for the middle Stratosphere. It shows the zonal wind reversing into negative territory on the 17th of February (red box). Image by stratobserve.com

But marked in the blue box is another strong disruption, coming next week and into early March. That will also help to enhance any potential weather response, as it further amplifies the impact of the first main disruption event.
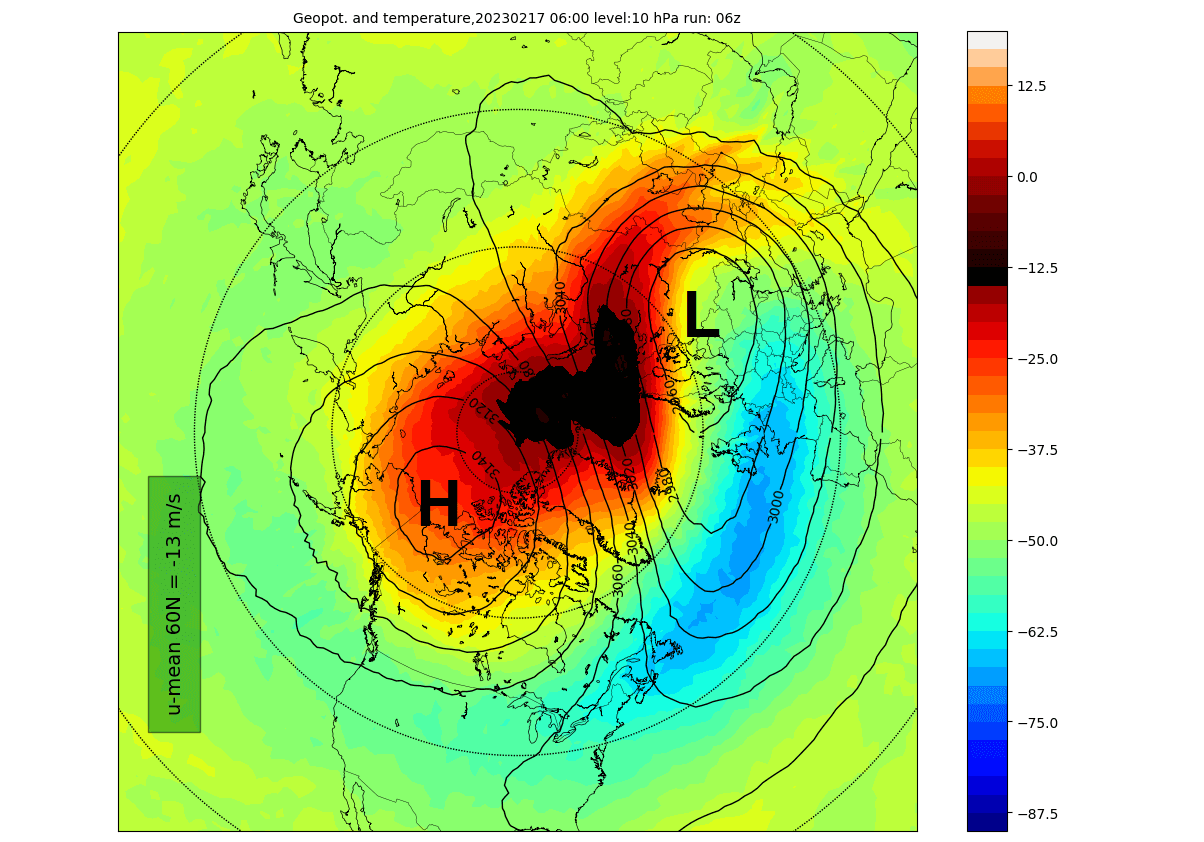
Looking at the first day of the SSW event below, you can see the large warming wave in the analysis for the mid-stratosphere. It spread over the polar regions. Combined with a strong emerging polar “anti-vortex” covering the North Pacific and western Arctic, it has pushed and displaced the Polar Vortex out of the North Pole.
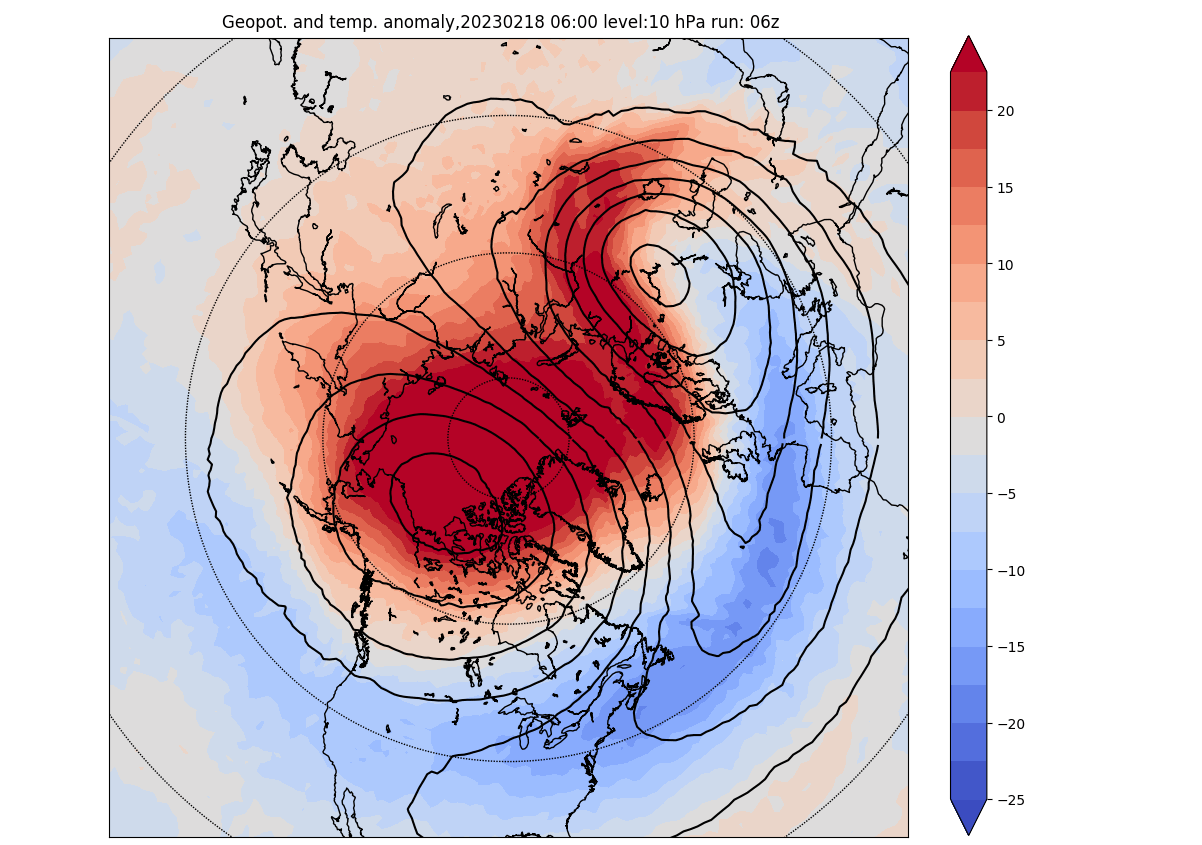
In the next image below, you can see the temperature anomaly for the same mid-stratospheric levels. It better highlights the actual sudden stratospheric warming event. Again, you can see that the temperatures were raised well above normal levels.
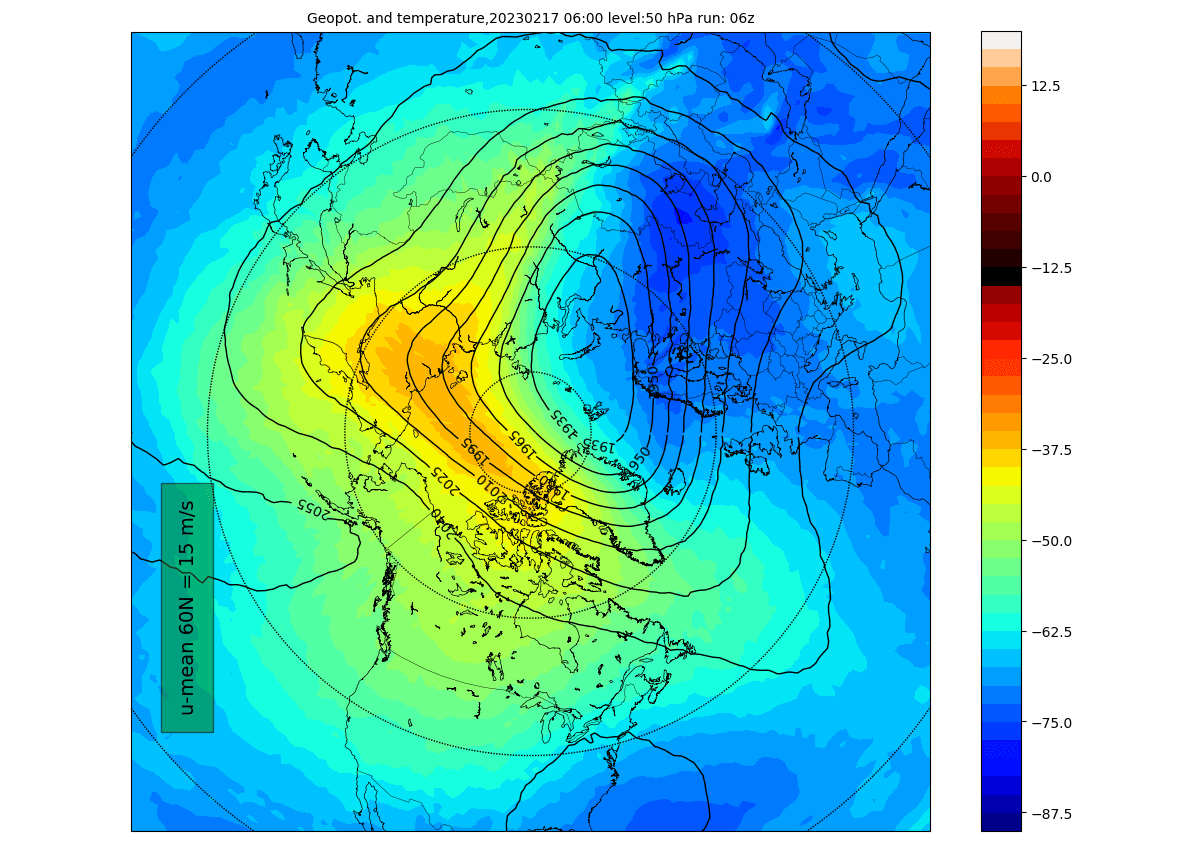
Going further down into the lower Stratosphere (19km/12miles), you can see in the analysis below that the warming wave quickly reached further down. As we said before, the lower the warming goes, the more robust it is. So reaching down to these levels shows that this is a strong event.
But what is the latest condition of the Polar Vortex following the main warming event?
The vertical pressure anomaly structure is getting more important at this point. It can show connections points and changes in the pressure patterns. You can see this much better in the 3D vertical analysis below.
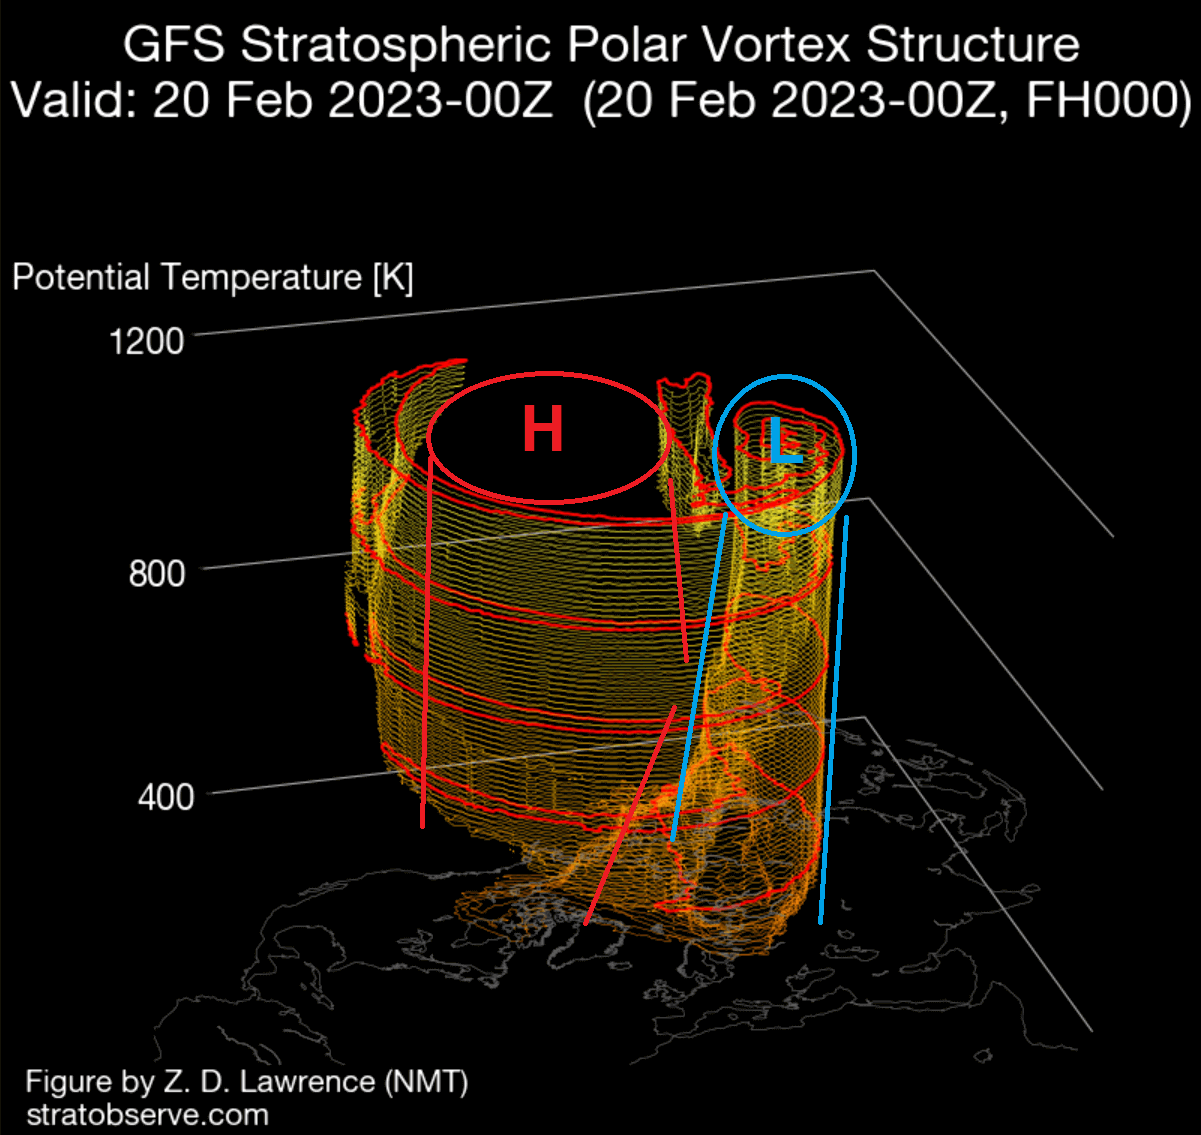
You can see the compressed Polar Vortex over Siberia. This is because a strong stratospheric high-pressure area (H) has taken over the Polar Regions and severely disrupted the atmospheric circulation in the higher and middle latitudes.
The disruption is on a large scale and is extended over much of the Stratosphere.
But proper weather effects can come several days after an SSW. But first, they have to filter down from the high levels of the Stratosphere down to the lower levels where our weather is.
STRATOSPHERIC WARMING EFFECTS
This is where the key to weather impacts is. The effects from the Stratosphere have to progress downwards. And that can take some time. But how does it actually work? How can an SSW actually change the weather?
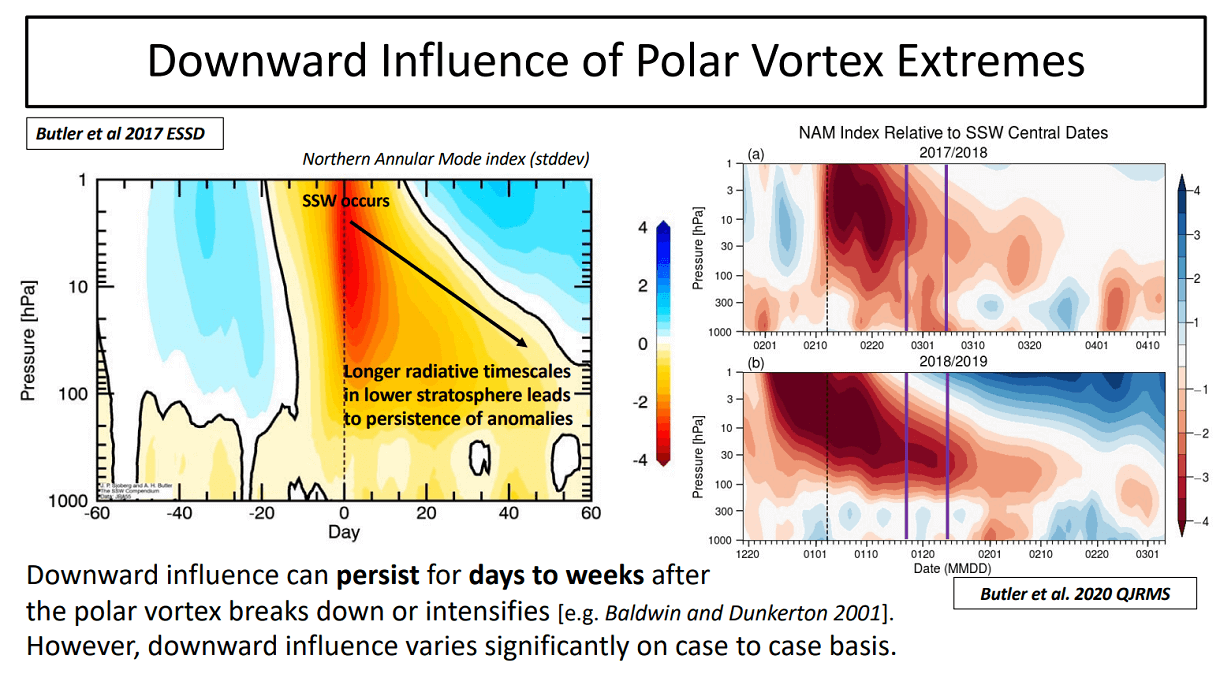
You can see a typical SSW process in the next image below by Dr. Amy Butler and co-authors. As an SSW occurs, it raises temperature and pressure in the Stratosphere. Those effects progress downwards over time.
So to simplify, the main impact of an SSW event is a high-pressure system “from above.” A manifestation of a high-pressure system in the lower levels can mean a disruption of weather patterns and strong changes in the jet stream.
We have a special graphic below to know what to look for. It shows the average pressure anomalies 0-30 days after many different Sudden Stratospheric Warming events. So it is an average picture of the first 30 days after many historic SSW events.
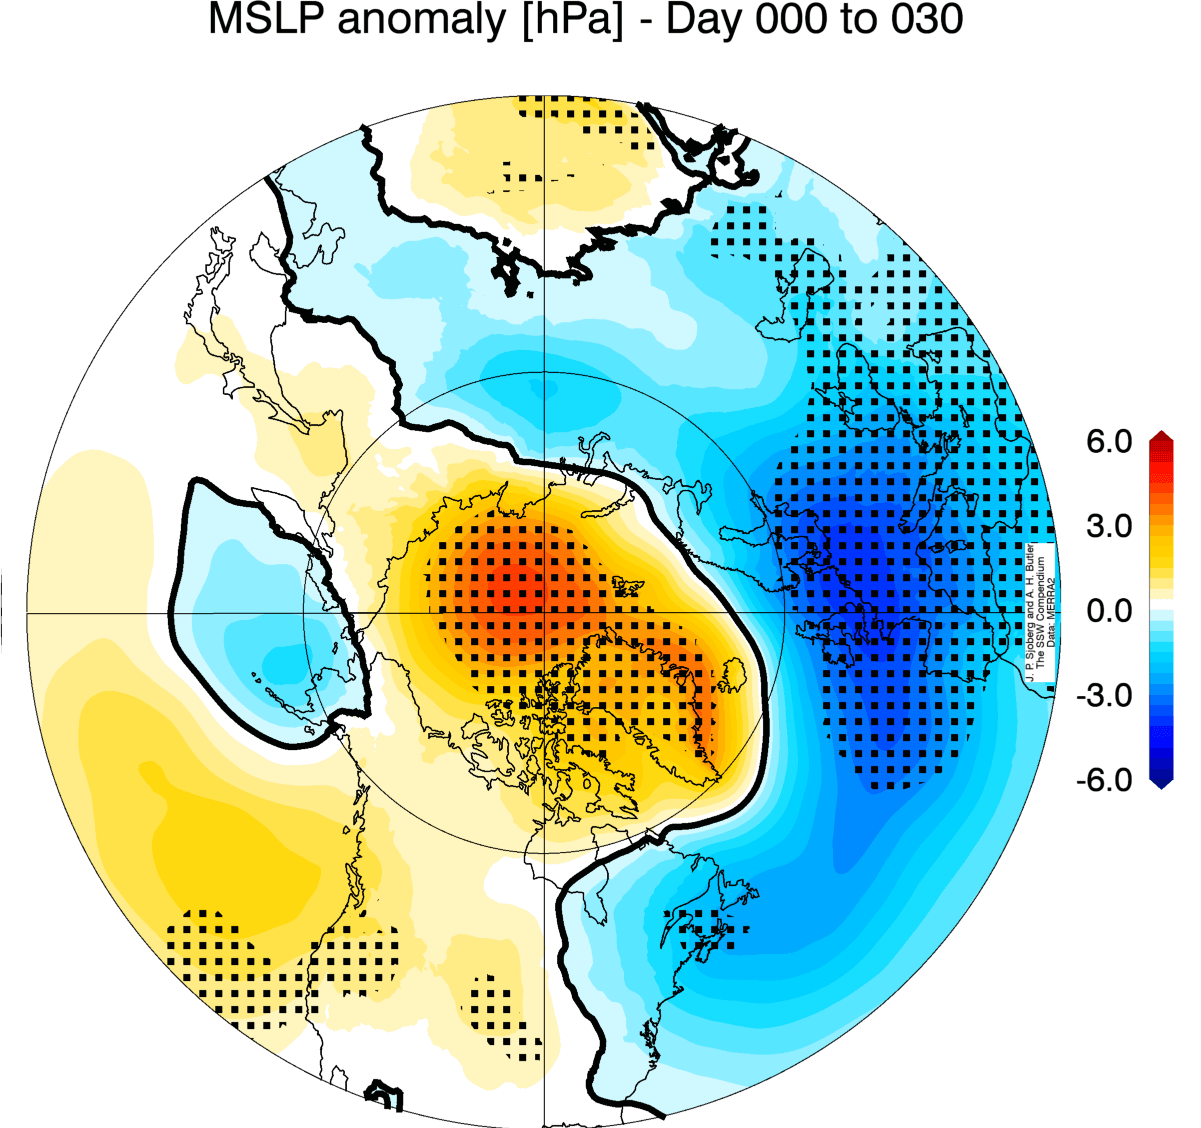
You can see the high-pressure anomaly developing over Greenland and the Arctic. In response, the pressure lowers over Europe and the eastern United States. This is an average picture, so it can vary from one event to another.
But, the effects of a Sudden Stratospheric Warming event can take several days to weeks before they connect to the weather below. In some individual cases, they never really connect with the weather.
The best way to follow SSW effects development is to look at atmospheric changes over time. Below are three graphics showing temperature, pressure, and wind anomalies in the Stratosphere, changing with time.
The first image below shows atmospheric pressure anomalies. Negative values indicate lower pressure (red anomalies), and positive values indicate higher pressure (blue colors). We have altitude from the ground up to the top of the Stratosphere (~46km/28mi).
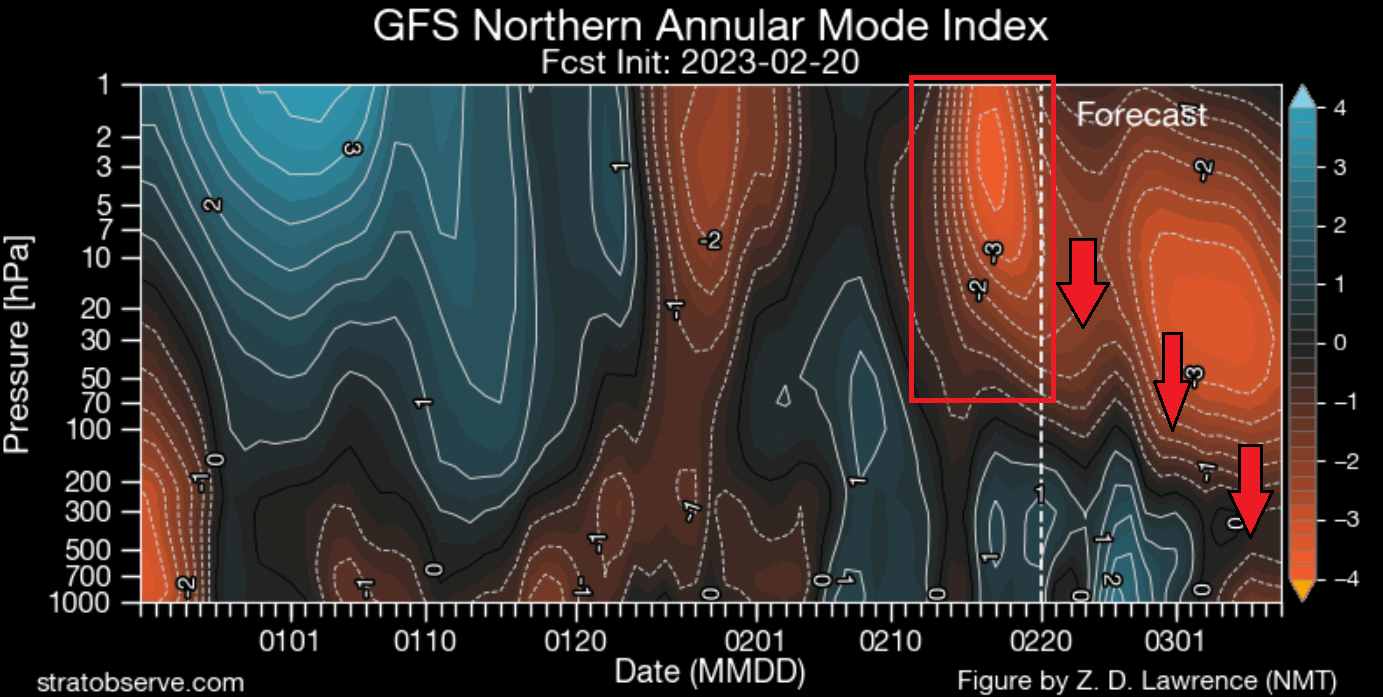
This is the main graphic and the holy grail of tracking Sudden Stratospheric Warming effects. You can see high-pressure anomalies from the Stratosphere slowly translated to lower levels in early March. This is currently the target window for the first visible weather impacts of the SSW.
So as we can already see a connection forming between the Stratosphere and the troposphere, we can look at the first medium-range weather changes from the SSW.
THE WEATHER IS CHANGING
Combining all the information provided, we are essentially looking for a high-pressure blocking system around the Greenland area. The word blocking implies that the system is large and persistent.
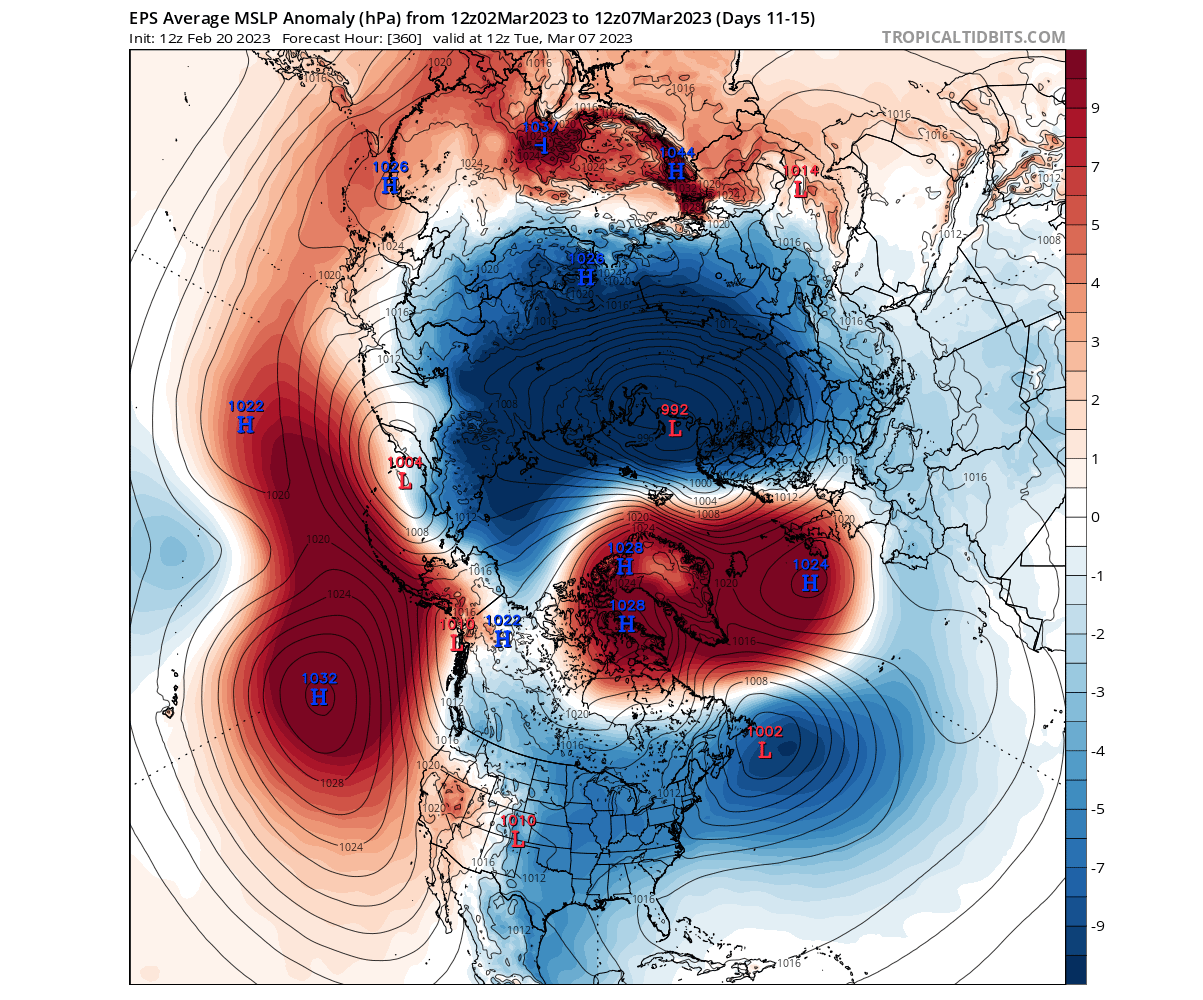
So looking at the actual forecast, we start with the ECMWF solution for early March. It shows the same pressure pattern as expected after an SSW event. So you can see high pressure in the Greenland area and the displaced low-pressure systems around it.

The image above is for the 5km/3miles altitude. But looking at the surface pressure anomalies, you can see the obvious high-pressure area over Greenland and the North Atlantic. So this is starting out as a pretty textbook initial response to the SSW event.
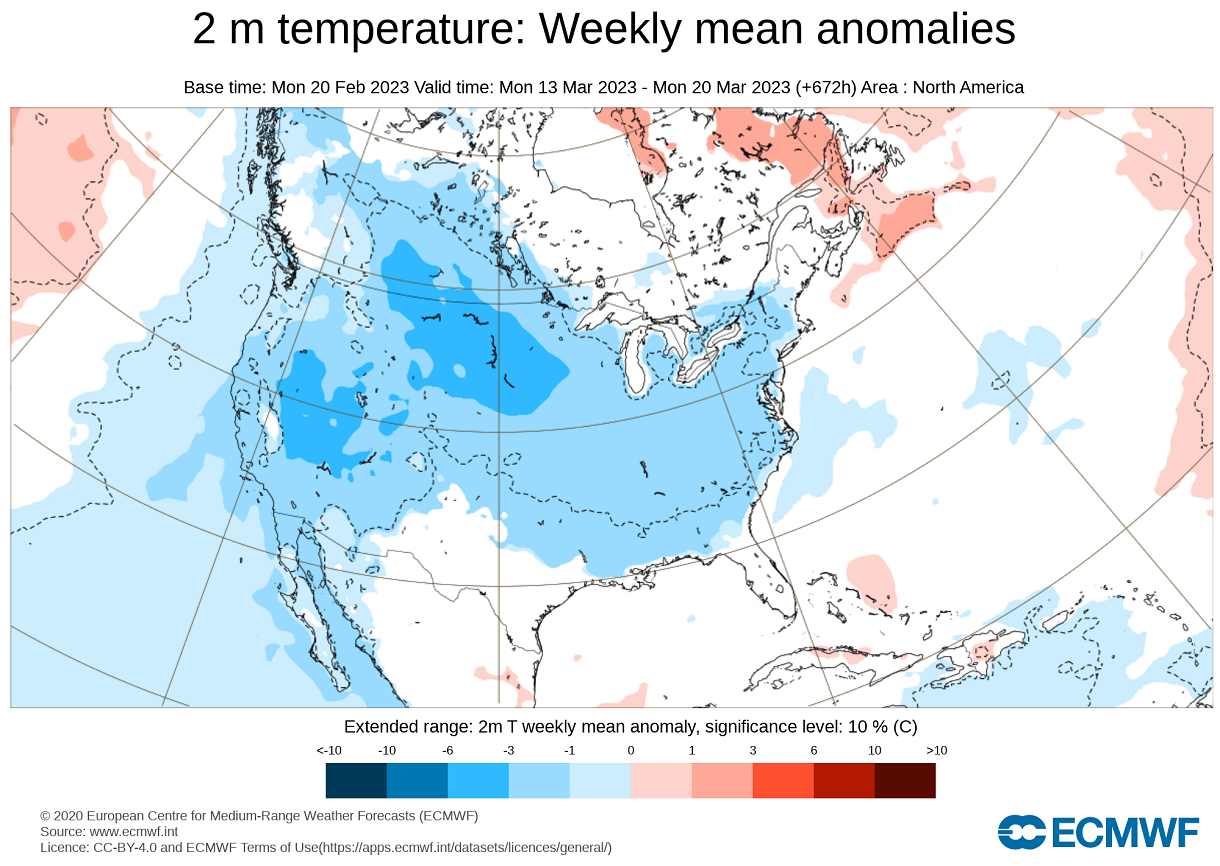
The resulting temperature pattern over North America is no surprise. You can see a cold anomaly over western Canada and the western half of the United States. A strong warm anomaly region is present over eastern Canada and the Greenland area.
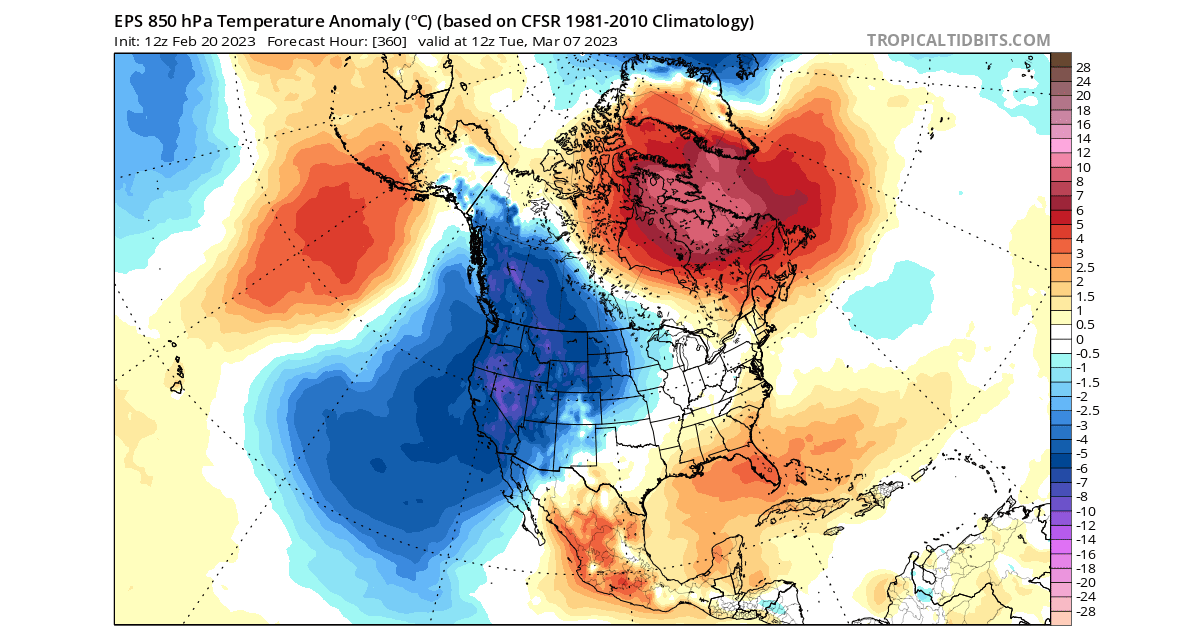
This implies continued cold weather for the western United States in early March. Despite a lack of a strong cold signal for the eastern United States, we can see an expansion starting towards the east.
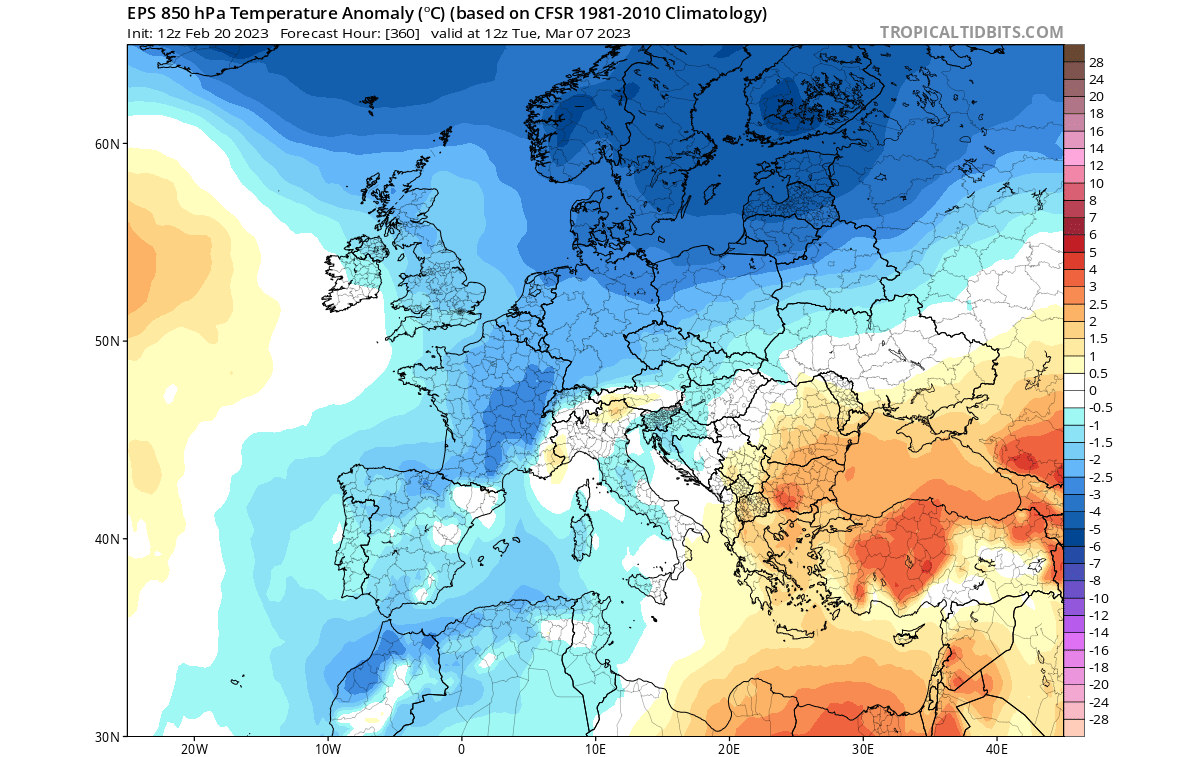
Europe shows a weaker cold signal, as the low-pressure anomaly is forecast further to the northeast. But it is still enough to get a northerly flow over the British Isles and into the central parts of the continent in early March.
Of course, we must look at different solutions in this range and following strong atmospheric events. So for that reason, we are also looking at the GEFS ensemble forecast from the Unites States NCEP center.
GEFS FORECAST
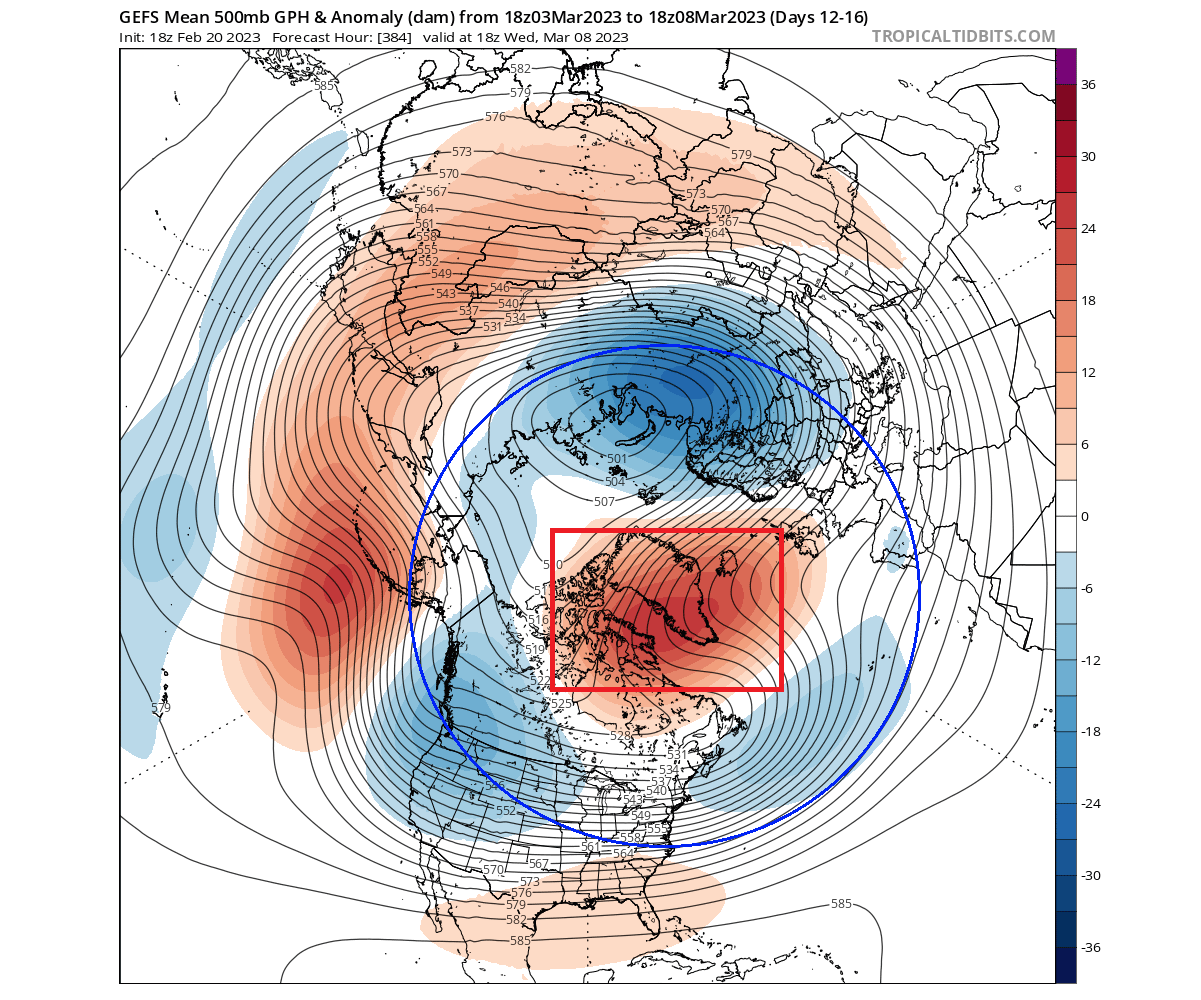
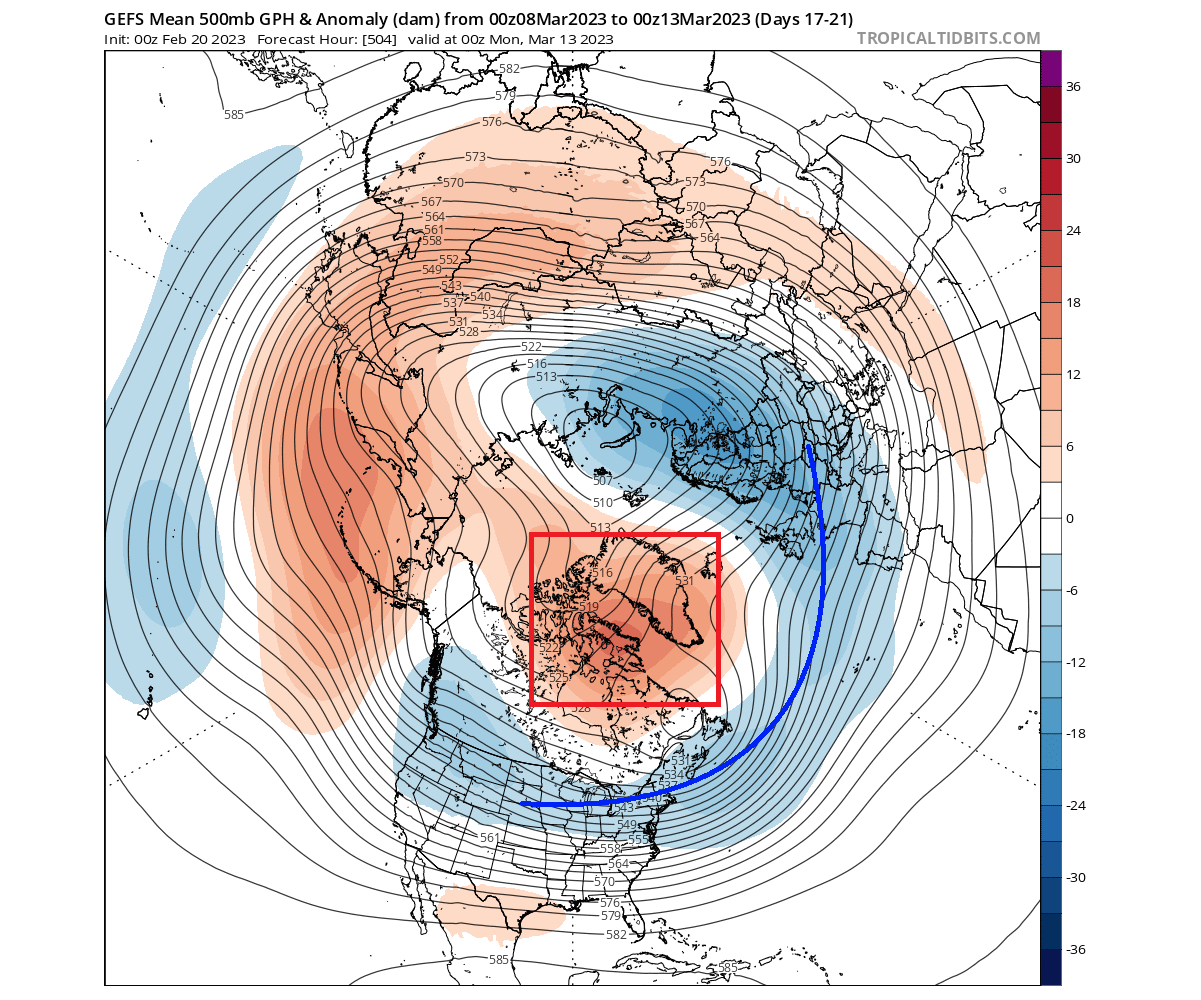
Looking at the geopotential height anomalies again, you can see that this model solution shows the exact same pattern. Again, a strong blocking high over Greenland and the displaced low-pressure systems.
Like the ECMWF, you can see an almost identical weather response over North America. Cold Winter air will remain over western Canada, extending cold anomalies into the western Half of the United States. The eastern half of the United States does show normal temperatures, but in this range, you can expect the expansion of the colder air towards the east.
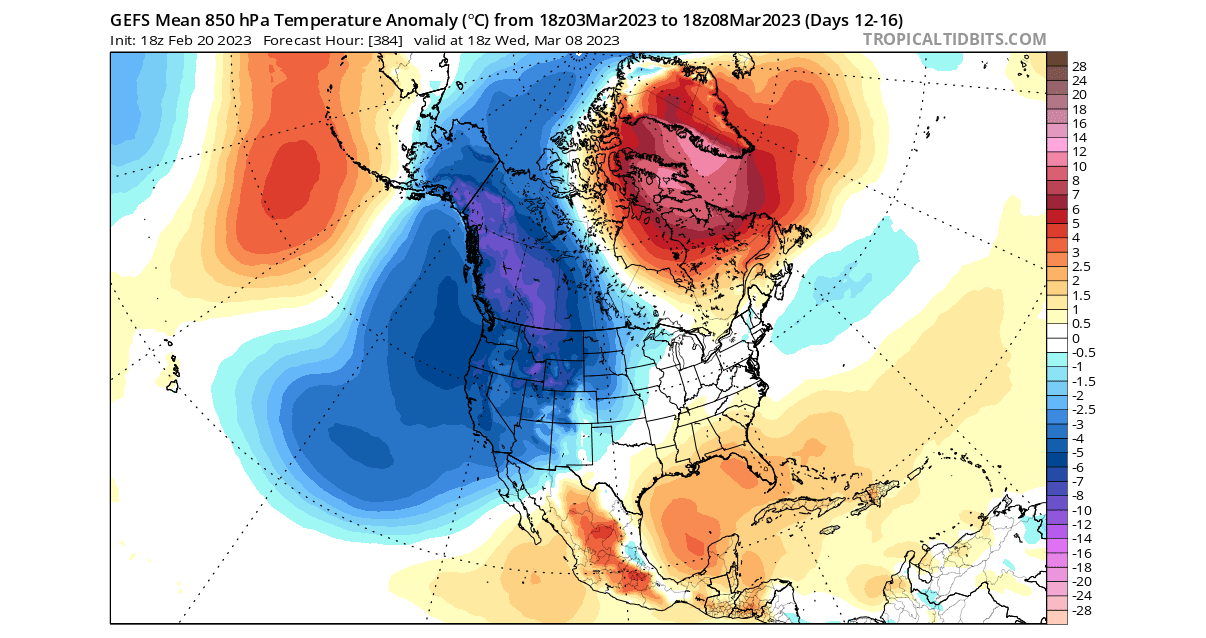
A warm anomaly area will persist over eastern and northeastern Canada under the direct impact of the high-pressure blocking system.
Looking at precipitation, we can see an area of more precipitation over the Ohio valley and the Pacific Northwest. This is important when we are tracking the snowfall potential.

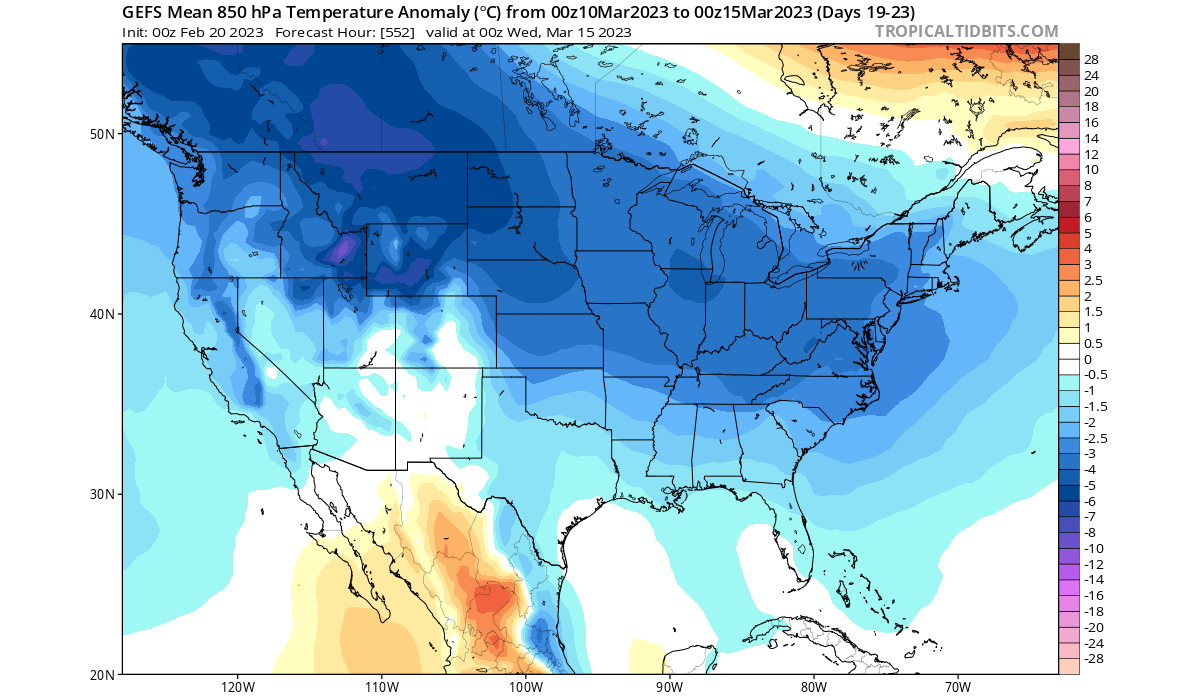
For snowfall potential, we have to look specifically at surface temperature patterns. Below we have the surface temperature anomaly in early March. The main snowfall potential is over the northwestern United States and western Canada. Snowfall potential is also expanded into the upper Midwest.

The eastern half of the United States is lacking colder temperatures at this point. But, given the expected pattern of evolution, the colder air will expand into the eastern Half of the United States and partially into southeastern Canada.
Over Europe, we also see the main cold anomaly being pushed further to the northeast. Some cold air expansion is seen towards the central regions but is weaker as the main low-pressure systems are further to the northeast.
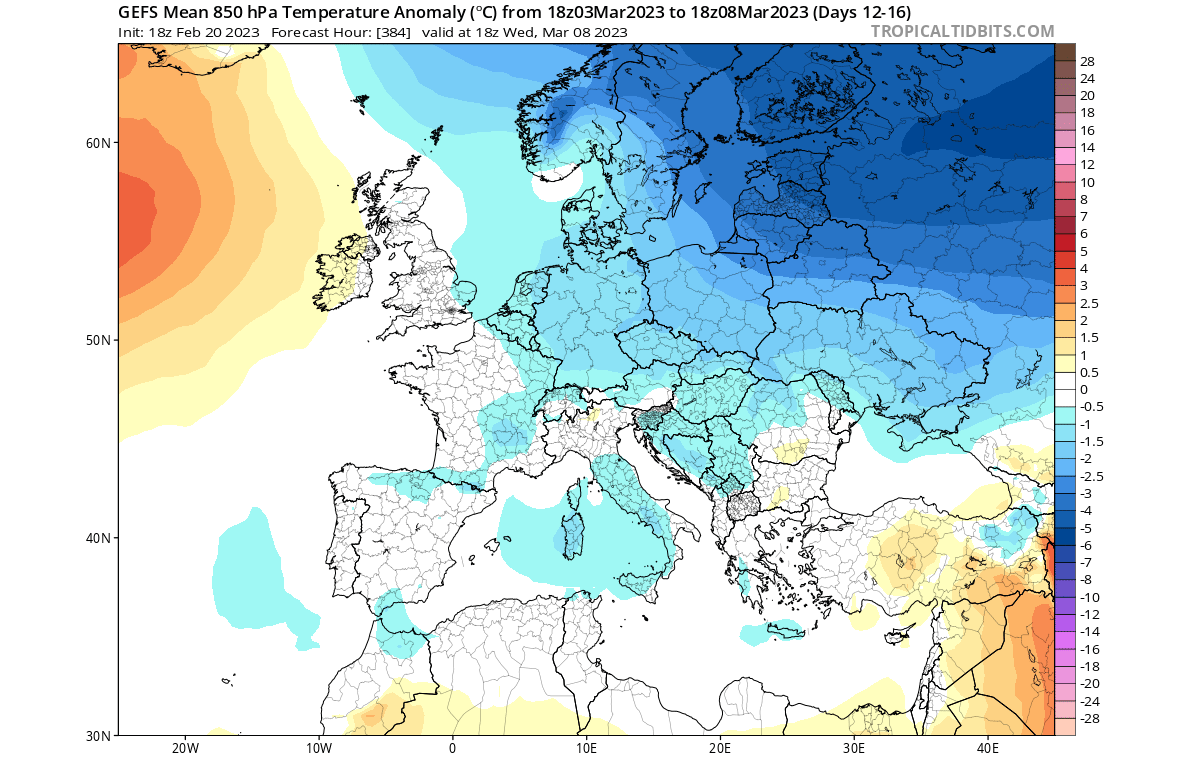
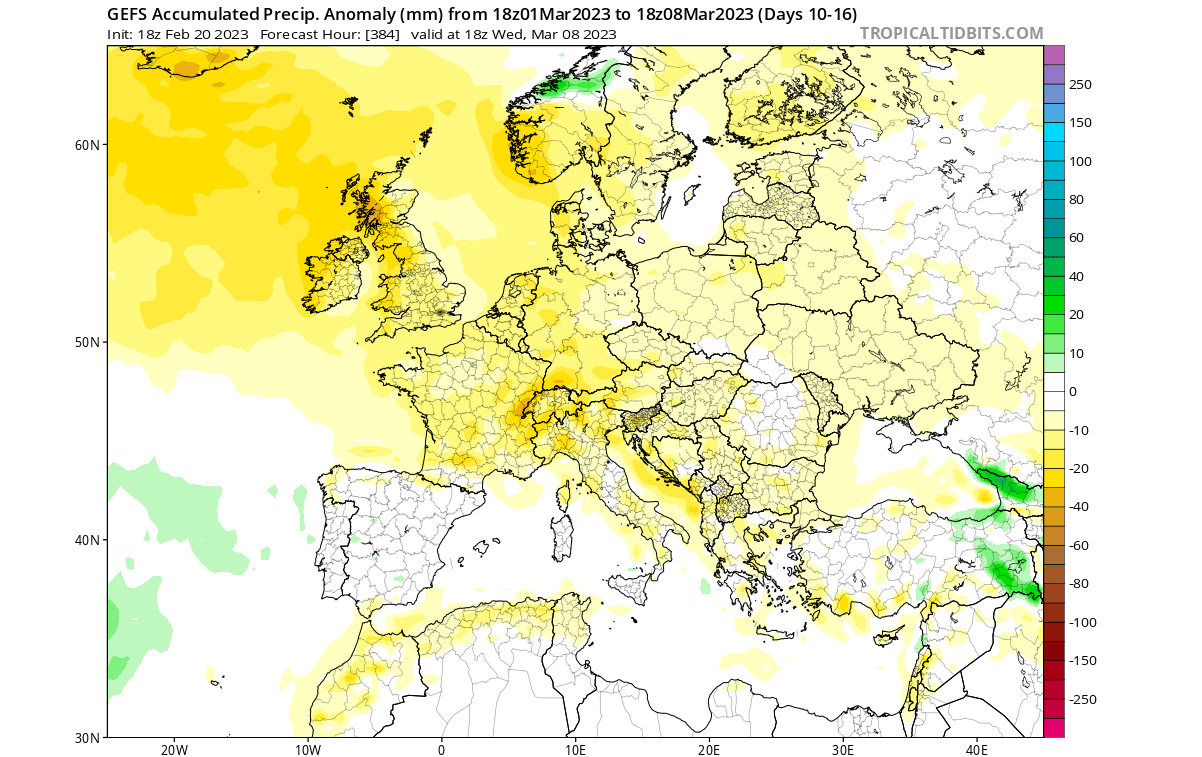
The northerly airflow means less moisture, so the forecast shows below-normal precipitation in this range over most of the continent.
We can see that in the medium range, the model solutions agree about the weather pattern changes following the stratospheric warming. But this is just the beginning, and we can look deeper into mid-March for the further evolution of the pattern.
EXTENDED RANGE WEATHER FORECAST
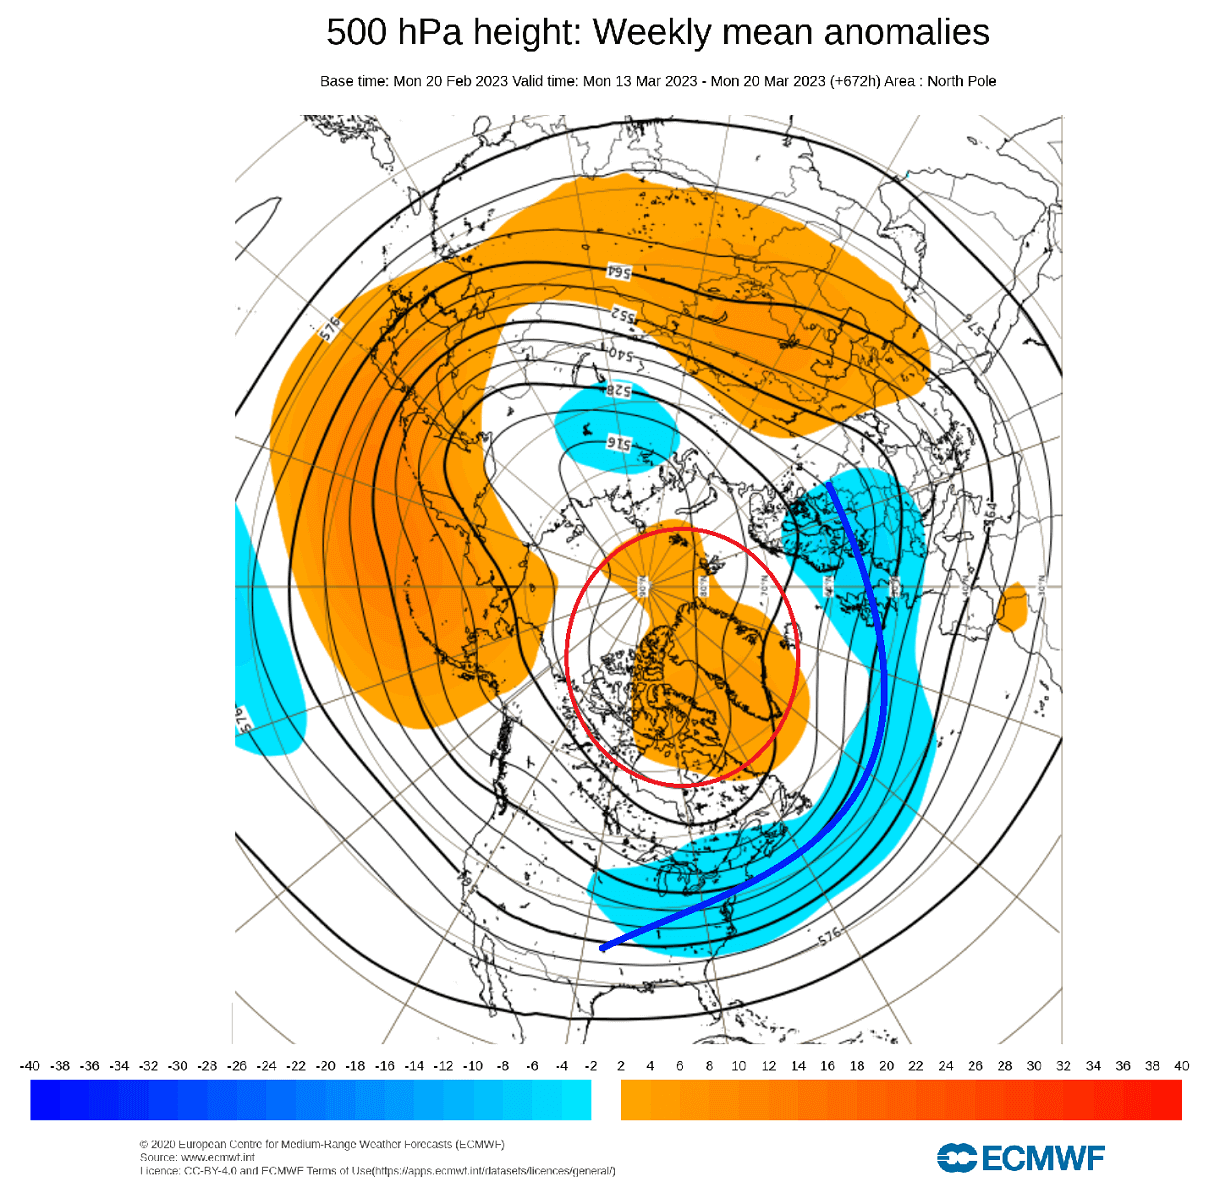
Looking at the ECMWF first, you can see the same pattern continuing into mid-March. The typical post-stratospheric warming high-pressure anomaly over Greenland and the low-pressure ring around it. This pattern is more supportive of cold air expansion into the eastern United States.
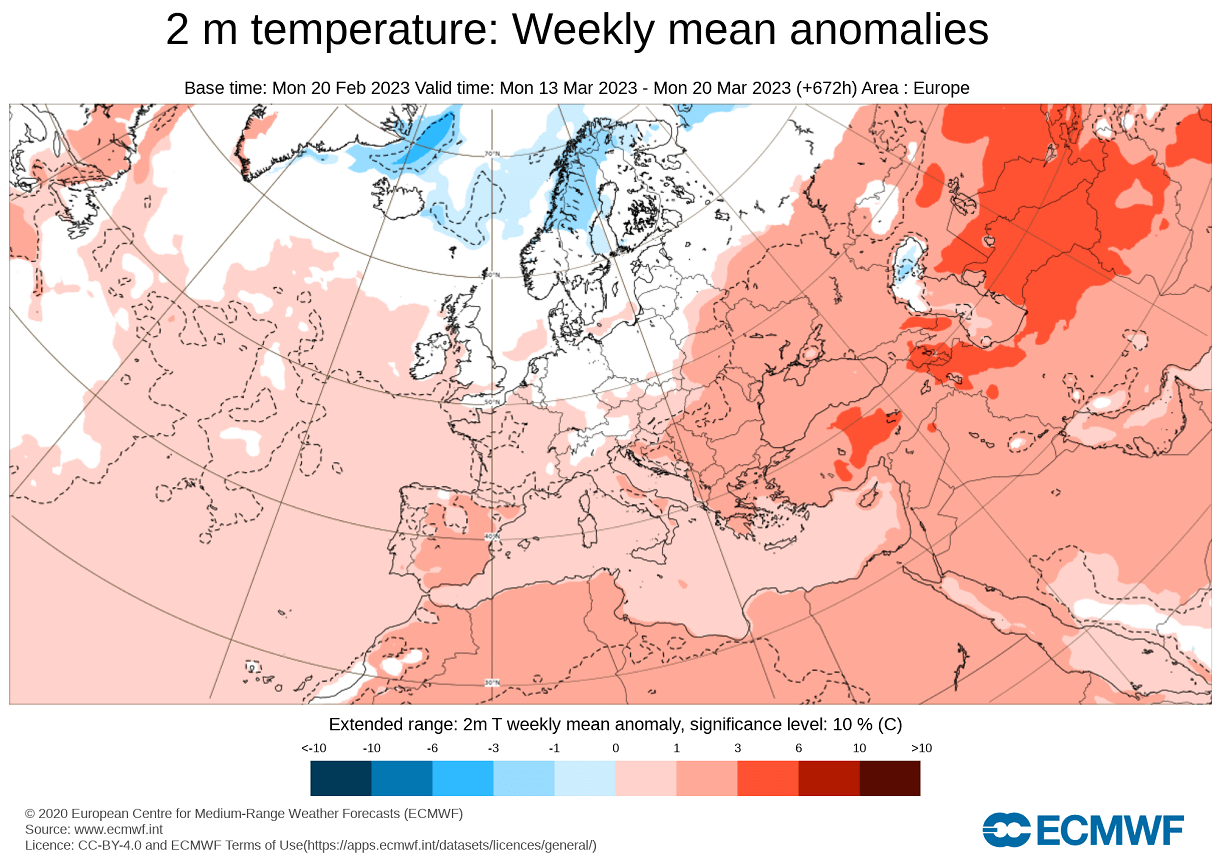
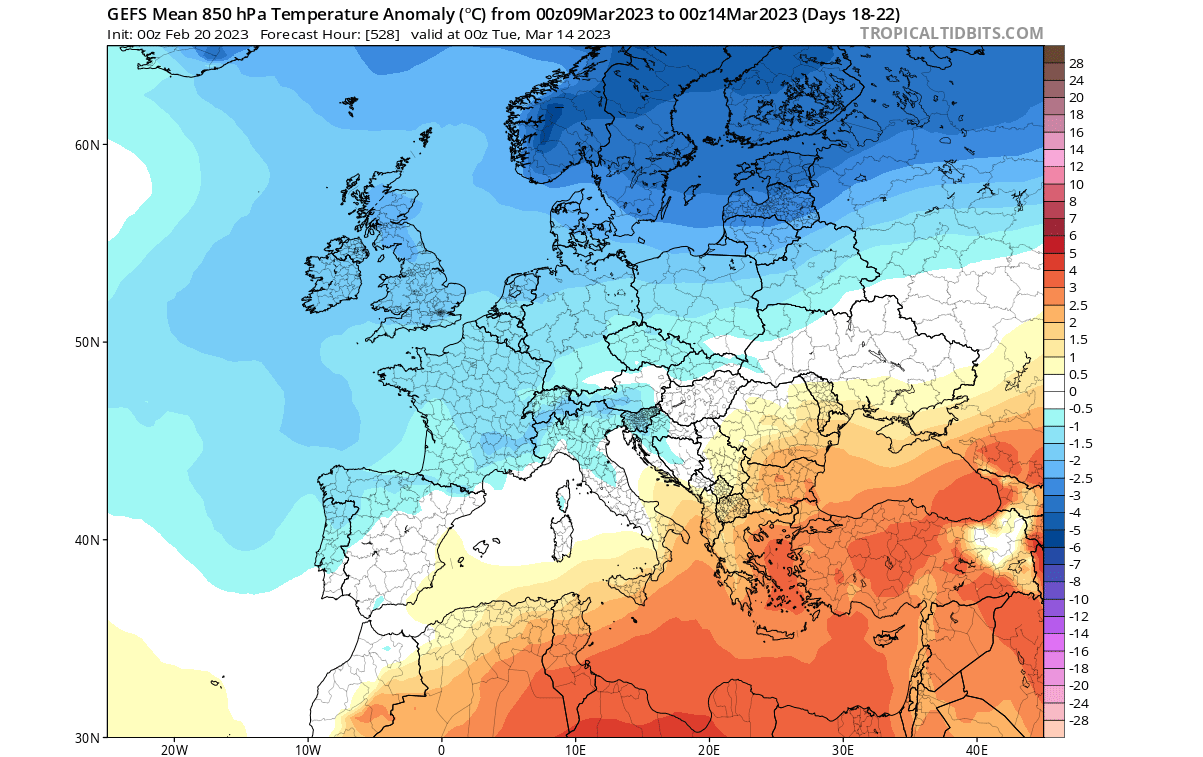
Looking at the temperatures for Europe first, we can see a general lack of colder air anomalies over the continent. However, cold air is present over northern Europe, with a potentially brief extension into central parts.
Over North America, we see the stratospheric warming “jackpot” as the weather changes bring a cold air outbreak into the eastern United States. This is expected from these pattern changes, but it is still far from certain at this range.
But given that the background driver of these pattern changes is a stratospheric warming event, we tend to know what to expect based on the usual weather response after such events. And a late-season cold outbreak across the United States and into the east is one of the typical aftermaths.
The GEFS ensemble system also has an extended-range solution, showing the same blocking pattern continuing into mid-March—the blocking high over Greenland and the displaced low-pressure systems.
Over Europe, the cold air is indicated over much of the northern and central parts of the continent. It indicates continued northerly and northeasterly flow and is generally more favorable for cold than the extended ECMWF.
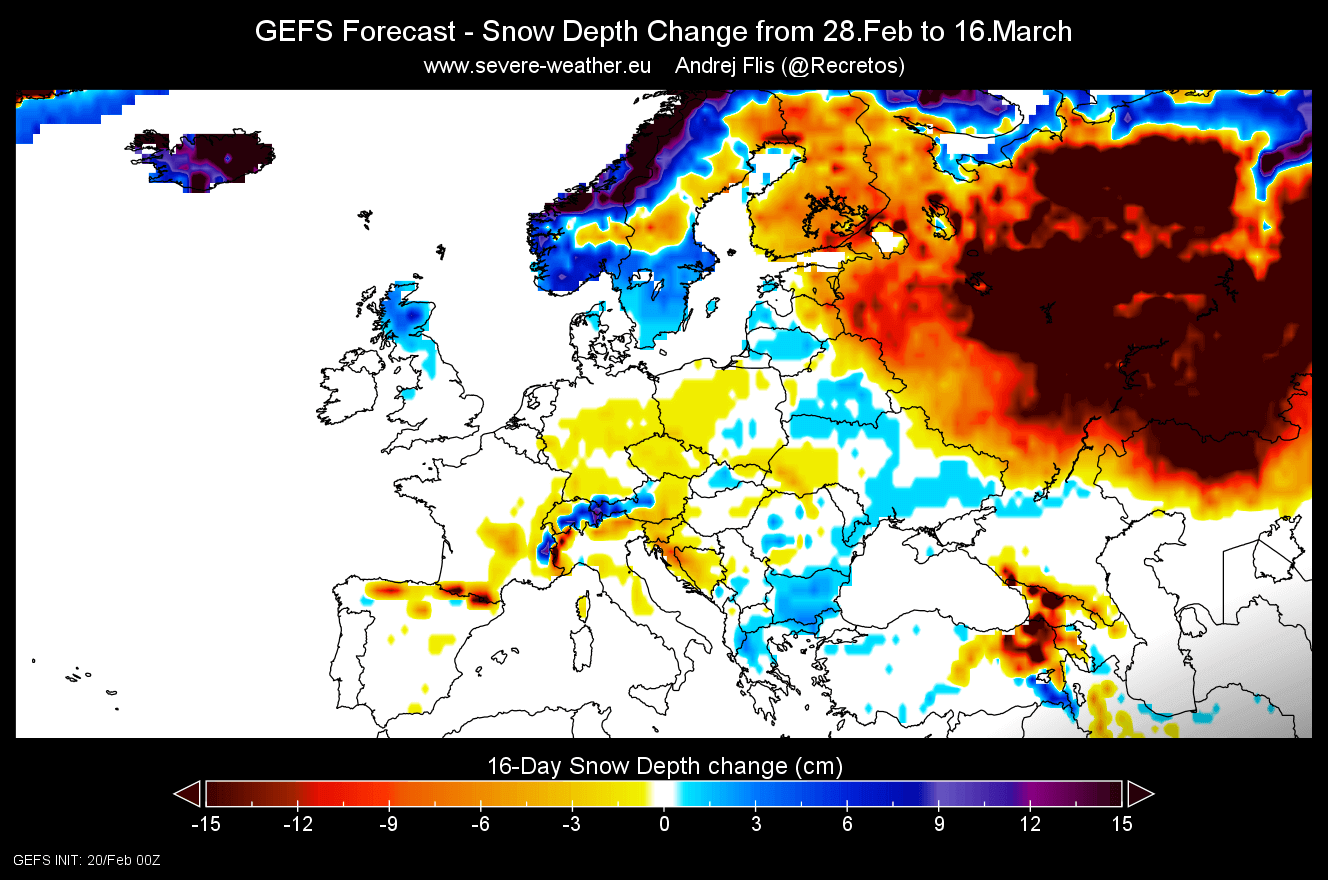
The snowfall forecast for the first half of March shows no big snow depth increase over mainland Europe in this range. But we see more snow in the northern parts of the United Kingdom and Scandinavia.
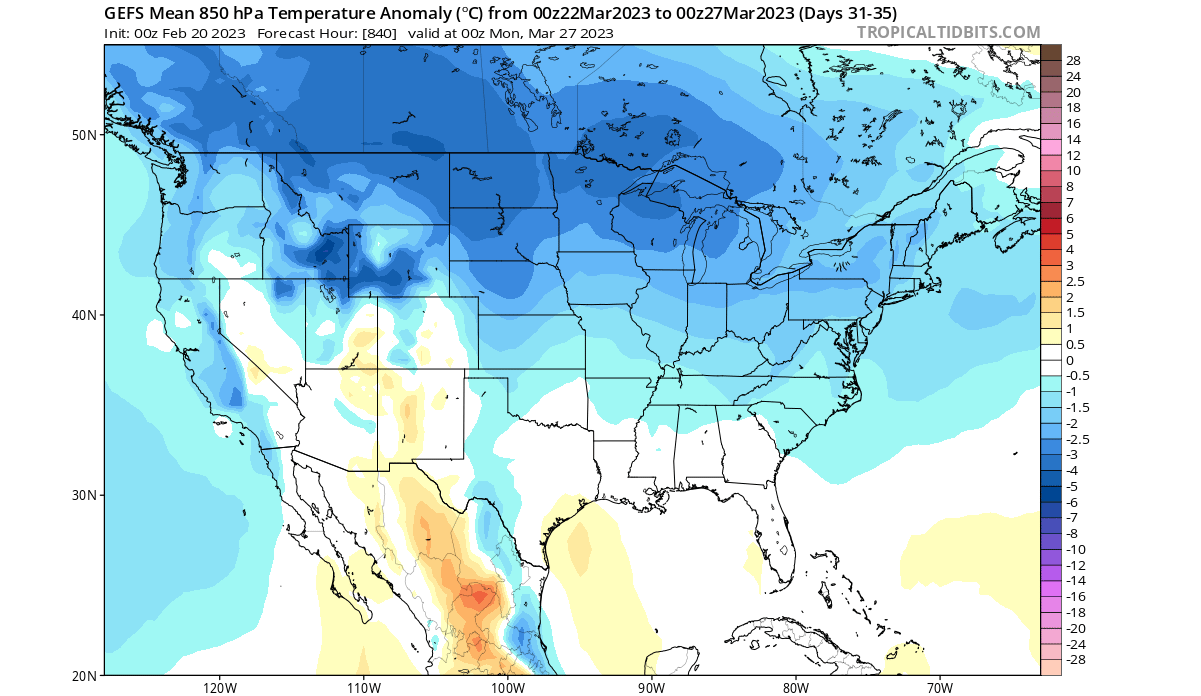
Over North America, the blocking pattern brings cold air extension into the eastern half of the United States. This is exactly the same as the ECMWF extended forecast and is an expected progression with a strong blocking high over Greenland.
Much of the country is colder than normal. Given the strength of the anomalies at these longer ranges, this could signal a significant cold air outbreak across the northern, central, and eastern United States around early to mid-March.
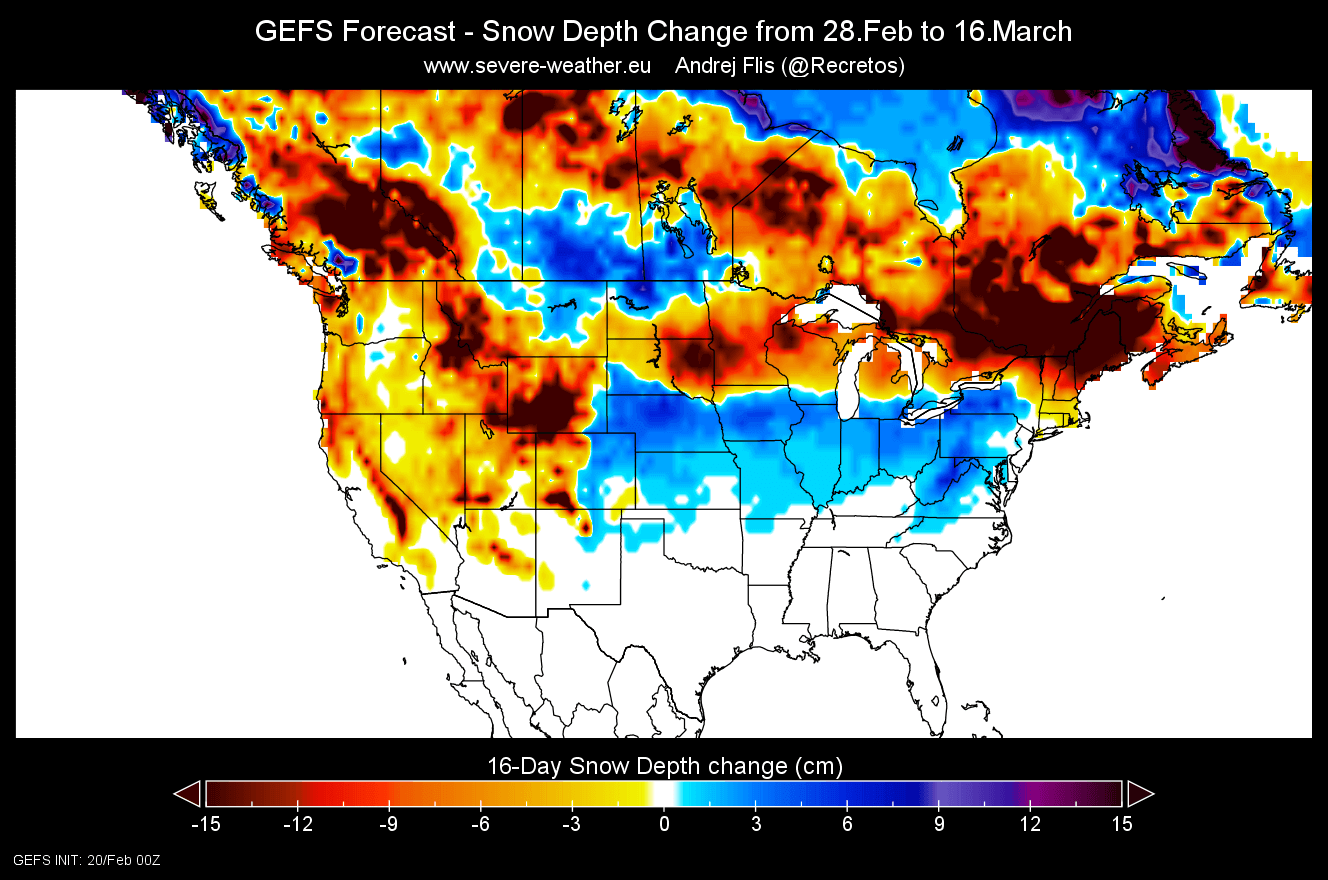
Also, looking at the snow depth changes till mid-March from GEFS, you can see a belt of increased snowfall from the central into the eastern United States. Based on the snowfall distribution, this looks like a single stronger event.
Taking a quick look into the second half of March, the colder trend continues and could bring March as a whole to colder-than-normal levels over much of the northern and eastern United States.
So as you can see, having a strong or weak Polar Vortex can significantly change the weather in the United States, Canada, and Europe. For this reason, we closely monitor the weather patterns and all activity surrounding the Polar Vortex.
We will keep you updated on the global weather pattern development, so bookmark our page. Also, if you have seen this article in the Google App (Discover) feed, click the like button (♥) there to see more of our forecasts and our latest articles on weather and nature in general.
Don’t miss: